 Web Server Statistics for freegw.xs4all.nl
Program started at Sat-01-Oct-2011 03:43.
Analysed requests from Thu-04-Nov-2010 18:00 to Sat-01-Oct-2011 03:42 (330.40 days).
Web Server Statistics for freegw.xs4all.nlProgram started at Sat-01-Oct-2011 03:43.
Analysed requests from Thu-04-Nov-2010 18:00 to Sat-01-Oct-2011 03:42 (330.40 days).
(Go To: Top | General Summary | Monthly Report | Daily Summary | Hourly Summary | Domain Report | Organisation Report | Search Word Report | Operating System Report | Status Code Report | File Size Report | File Type Report | Directory Report)
This report contains overall statistics.
Figures in parentheses refer to the 7-day period ending 01-Oct-2011 03:43.
Successful requests: 335,061 (14,589)
Average successful requests per day: 1,014 (2,084)
Successful requests for pages: 63,980 (1,347)
Average successful requests for pages per day: 193 (192)
Failed requests: 23,850 (465)
Redirected requests: 9,418 (68)
Distinct files requested: 66,150 (8,918)
Distinct hosts served: 16,289 (761)
Corrupt logfile lines: 67
Unwanted logfile entries: 8,220
Data transferred: 6.53 gigabytes (371.87 megabytes)
Average data transferred per day: 20.22 megabytes (53.12 megabytes)
(Go To: Top | General Summary | Monthly Report | Daily Summary | Hourly Summary | Domain Report | Organisation Report | Search Word Report | Operating System Report | Status Code Report | File Size Report | File Type Report | Directory Report)
This report lists the activity in each month.
Each unit ( ) represents 200 requests for pages or part thereof.
| month | reqs | pages | |
|---|---|---|---|
| Nov 2010 | 21313 | 6740 |   |
| Dec 2010 | 28588 | 7133 |  |
| Jan 2011 | 20874 | 7207 | |
| Feb 2011 | 25200 | 7290 | |
| Mar 2011 | 32812 | 5371 |   |
| Apr 2011 | 25896 | 4871 | |
| May 2011 | 27271 | 5165 | |
| Jun 2011 | 31791 | 5291 | |
| Jul 2011 | 36899 | 6234 | |
| Aug 2011 | 42252 | 4367 | |
| Sep 2011 | 41945 | 4284 | |
| Oct 2011 | 220 | 27 | |
Busiest month: Feb 2011 (7,290 requests for pages).
(Go To: Top | General Summary | Monthly Report | Daily Summary | Hourly Summary | Domain Report | Organisation Report | Search Word Report | Operating System Report | Status Code Report | File Size Report | File Type Report | Directory Report)
This report lists the total activity for each day of the week, summed over all the weeks in the report.
Each unit () represents 250 requests for pages or part thereof.
| day | reqs | pages | |
|---|---|---|---|
| Sun | 43700 | 9352 | |
| Mon | 40147 | 7505 | |
| Tue | 48484 | 8974 | |
| Wed | 59614 | 8833 | |
| Thu | 50882 | 10645 | |
| Fri | 48242 | 9512 | |
| Sat | 43992 | 9159 | |
(Go To: Top | General Summary | Monthly Report | Daily Summary | Hourly Summary | Domain Report | Organisation Report | Search Word Report | Operating System Report | Status Code Report | File Size Report | File Type Report | Directory Report)
This report lists the total activity for each hour of the day, summed over all the days in the report.
Each unit () represents 80 requests for pages or part thereof.
| hour | reqs | pages | |
|---|---|---|---|
| 0 | 11730 | 2315 | |
| 1 | 11668 | 2381 | |
| 2 | 12033 | 2404 | |
| 3 | 12231 | 3199 | |
| 4 | 11629 | 2292 | |
| 5 | 12029 | 2883 | |
| 6 | 12409 | 2484 | |
| 7 | 10561 | 2274 | |
| 8 | 11939 | 2544 | |
| 9 | 12512 | 2356 | |
| 10 | 14358 | 2672 | |
| 11 | 15445 | 3525 | |
| 12 | 15407 | 2790 | |
| 13 | 15283 | 2659 | |
| 14 | 14460 | 2490 | |
| 15 | 14877 | 2596 | |
| 16 | 15257 | 2617 | |
| 17 | 14383 | 2626 | |
| 18 | 16192 | 3011 | |
| 19 | 17014 | 2602 | |
| 20 | 16905 | 3069 | |
| 21 | 17642 | 2676 | |
| 22 | 14645 | 2617 | |
| 23 | 14452 | 2898 | |
(Go To: Top | General Summary | Monthly Report | Daily Summary | Hourly Summary | Domain Report | Organisation Report | Search Word Report | Operating System Report | Status Code Report | File Size Report | File Type Report | Directory Report)
This report lists the countries of the computers which requested files.
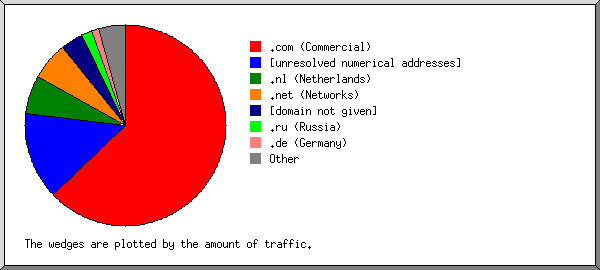
Listing domains, sorted by the amount of traffic.
| reqs | %bytes | domain |
|---|---|---|
| 132742 | 62.73% | .com (Commercial) |
| 66898 | 14.05% | [unresolved numerical addresses] |
| 40381 | 6.26% | .nl (Netherlands) |
| 36203 | 6.12% | .net (Networks) |
| 12623 | 3.67% | [domain not given] |
| 9091 | 1.71% | .ru (Russia) |
| 7791 | 1.16% | .de (Germany) |
| 4440 | 0.48% | .be (Belgium) |
| 4127 | 0.40% | .fr (France) |
| 1364 | 0.29% | .ua (Ukraine) |
| 2127 | 0.25% | .jp (Japan) |
| 1200 | 0.25% | [unknown domain] |
| 1295 | 0.24% | .md (Moldova) |
| 1226 | 0.23% | .il (Israel) |
| 977 | 0.17% | .pl (Poland) |
| 740 | 0.16% | .se (Sweden) |
| 785 | 0.15% | .lv (Latvia) |
| 1467 | 0.15% | .ch (Switzerland) |
| 667 | 0.13% | .dk (Denmark) |
| 710 | 0.12% | .ro (Romania) |
| 382 | 0.10% | .uk (United Kingdom) |
| 737 | 0.10% | .it (Italy) |
| 659 | 0.09% | .br (Brazil) |
| 335 | 0.09% | .org (Non Profit Making Organisations) |
| 464 | 0.09% | .cn (China) |
| 175 | 0.06% | .info (Informational) |
| 270 | 0.06% | .lt (Lithuania) |
| 533 | 0.05% | .pt (Portugal) |
| 334 | 0.05% | .nz (New Zealand) |
| 139 | 0.04% | .at (Austria) |
| 255 | 0.04% | .hu (Hungary) |
| 262 | 0.04% | .es (Spain) |
| 308 | 0.04% | .fi (Finland) |
| 200 | 0.03% | .au (Australia) |
| 159 | 0.03% | .lu (Luxembourg) |
| 233 | 0.02% | .id (Indonesia) |
| 206 | 0.02% | .gr (Greece) |
| 26 | 0.02% | .tw (Taiwan) |
| 169 | 0.02% | .ca (Canada) |
| 63 | 0.02% | .sg (Singapore) |
| 102 | 0.02% | .hr (Croatia) |
| 243 | 0.02% | .tr (Turkey) |
| 123 | 0.02% | .bg (Bulgaria) |
| 130 | 0.01% | .mx (Mexico) |
| 78 | 0.01% | .biz (Businesses) |
| 84 | 0.01% | .ee (Estonia) |
| 52 | 0.01% | .no (Norway) |
| 84 | 0.01% | .my (Malaysia) |
| 155 | 0.01% | .cz (Czech Republic) |
| 60 | 0.01% | .edu (USA Higher Education) |
| 120 | 0.01% | .th (Thailand) |
| 49 | 0.01% | .co (Colombia) |
| 103 | 0.01% | .in (India) |
| 59 | 0.01% | .ar (Argentina) |
| 61 | 0.01% | .arpa (Arpanet) |
| 34 | 0.01% | .us (United States) |
| 29 | .su (Former USSR) | |
| 23 | .ug (Uganda) | |
| 43 | .by (Belarus) | |
| 53 | .vn (Vietnam) | |
| 37 | .sk (Slovakia) | |
| 10 | .ie (Ireland) | |
| 14 | .uy (Uruguay) | |
| 16 | .ws (Samoa) | |
| 20 | .ae (United Arab Emirates) | |
| 25 | .ge (Georgia) | |
| 16 | .lk (Sri Lanka) | |
| 13 | .io (British Indian Ocean Territory) | |
| 38 | .sa (Saudi Arabia) | |
| 14 | .ba (Bosnia-Herzegovina) | |
| 21 | .is (Iceland) | |
| 31 | .int (International Treaty Organisations) | |
| 11 | .tv (Tuvalu) | |
| 40 | .do (Dominican Republic) | |
| 34 | .ph (Philippines) | |
| 8 | .hn (Honduras) | |
| 17 | .jo (Jordan) | |
| 5 | .mk (Macedonia (Former Yugoslav Republic)) | |
| 9 | .hk (Hong Kong) | |
| 4 | .gov (USA Government) | |
| 12 | .za (South Africa) | |
| 16 | .pk (Pakistan) | |
| 7 | .ec (Ecuador) | |
| 27 | .li (Liechtenstein) | |
| 5 | .mil (USA Military) | |
| 6 | .tc (Turks and Caicos Islands) | |
| 7 | .cl (Chile) | |
| 6 | .yu (Former Yugoslavia) | |
| 5 | .ag (Antigua and Barbuda) | |
| 21 | .eg (Egypt) | |
| 5 | .ir (Iran) | |
| 4 | .zm (Zambia) | |
| 7 | .ni (Nicaragua) | |
| 4 | .cc (Cocos (Keeling) Islands) | |
| 7 | .ma (Morocco) | |
| 5 | .bo (Bolivia) | |
| 3 | .tg (Togo) | |
| 3 | .py (Paraguay) | |
| 3 | .la (Laos) | |
| 3 | .bn (Brunei Darussalam) | |
| 3 | .name (Individuals) | |
| 3 | .cr (Costa Rica) | |
| 3 | .kz (Kazakhstan) | |
| 5 | .ve (Venezuela) | |
| 2 | .az (Azerbaijan) | |
| 2 | .pe (Peru) | |
| 2 | .to (Tonga) | |
| 9 | .sy (Syria) | |
| 9 | .ye (Yemen) | |
| 4 | .gt (Guatemala) | |
| 4 | .ps (Occupied Palestinian Territory) | |
| 3 | .al (Albania) | |
| 1 | .tt (Trinidad and Tobago) | |
| 1 | .bm (Bermuda) | |
| 3 | .ke (Kenya) | |
| 3 | .np (Nepal) | |
| 3 | .am (Armenia) | |
| 2 | .bd (Bangladesh) | |
| 2 | .ci (Ivory Coast) | |
| 2 | .kh (Cambodia) | |
| 1 | .kg (Kyrgyzstan) | |
| 1 | .cy (Cyprus) | |
| 1 | .lb (Lebanon) | |
| 1 | .tj (Tajikistan) | |
| 1 | .mg (Madagascar) | |
| 1 | .uz (Uzbekistan) | |
| 1 | .gh (Ghana) | |
| 1 | .kr (South Korea) |
(Go To: Top | General Summary | Monthly Report | Daily Summary | Hourly Summary | Domain Report | Organisation Report | Search Word Report | Operating System Report | Status Code Report | File Size Report | File Type Report | Directory Report)
This report lists the organisations of the computers which requested files.
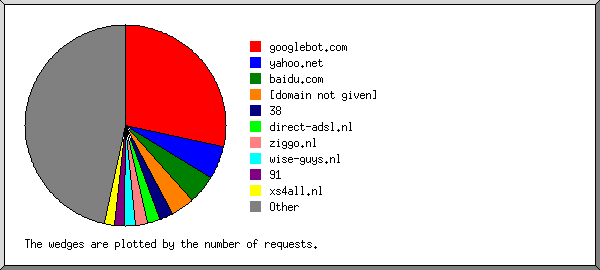
Listing the top 20 organisations by the number of requests, sorted by the number of requests.
| reqs | %bytes | organisation |
|---|---|---|
| 95472 | 53.21% | googlebot.com |
| 17796 | 3.46% | yahoo.net |
| 15372 | 4.98% | baidu.com |
| 12623 | 3.67% | [domain not given] |
| 7521 | 2.91% | 38 |
| 6625 | 0.80% | direct-adsl.nl |
| 6577 | 0.93% | ziggo.nl |
| 5777 | 1.69% | wise-guys.nl |
| 5568 | 1.16% | 91 |
| 5217 | 0.82% | xs4all.nl |
| 4126 | 0.56% | your-server.de |
| 4070 | 0.76% | 173.242 |
| 3833 | 0.26% | 69 |
| 3779 | 0.65% | 119 |
| 3347 | 0.22% | 180.76 |
| 3227 | 0.32% | wanadoo.fr |
| 3148 | 0.61% | 109 |
| 2952 | 0.52% | corbina.ru |
| 2809 | 0.22% | planet.nl |
| 2659 | 0.55% | yandex.ru |
| 122563 | 21.70% | [not listed: 2,851 organisations] |
(Go To: Top | General Summary | Monthly Report | Daily Summary | Hourly Summary | Domain Report | Organisation Report | Search Word Report | Operating System Report | Status Code Report | File Size Report | File Type Report | Directory Report)
This report lists which words people used in search engines to find the site.
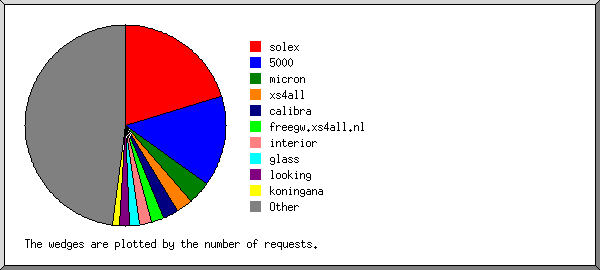
Listing the top 30 query words by the number of requests, sorted by the number of requests.
| reqs | search term |
|---|---|
| 765 | solex |
| 546 | 5000 |
| 141 | micron |
| 93 | xs4all |
| 91 | calibra |
| 81 | freegw.xs4all.nl |
| 72 | interior |
| 59 | glass |
| 59 | looking |
| 41 | koningana |
| 41 | papa |
| 41 | youtube |
| 41 | wemba |
| 41 | bo |
| 40 | banden |
| 37 | onderdelen |
| 30 | magneti |
| 30 | marelli |
| 29 | centrifugaal |
| 25 | red |
| 25 | rood |
| 25 | footage |
| 24 | ipv6 |
| 23 | c340 |
| 23 | nad |
| 20 | freegw |
| 19 | vifa |
| 19 | carat |
| 17 | tekening |
| 17 | boek |
| 1235 | [not listed: 509 search terms] |
(Go To: Top | General Summary | Monthly Report | Daily Summary | Hourly Summary | Domain Report | Organisation Report | Search Word Report | Operating System Report | Status Code Report | File Size Report | File Type Report | Directory Report)
This report lists the operating systems used by visitors.
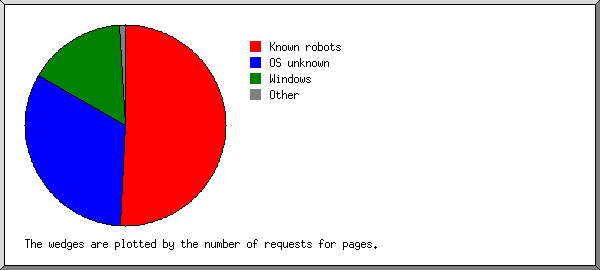
Listing operating systems, sorted by the number of requests for pages.
| no. | reqs | pages | OS |
|---|---|---|---|
| 1 | 59399 | 32267 | Known robots |
| 2 | 122077 | 20706 | OS unknown |
| 3 | 145141 | 10081 | Windows |
| 79377 | 7049 | Windows XP | |
| 22804 | 1493 | Windows 7 | |
| 14469 | 554 | Windows Vista | |
| 9439 | 314 | Windows 2000 | |
| 4682 | 190 | Windows NT | |
| 4674 | 160 | Windows Server 2003 | |
| 2440 | 116 | Windows ME | |
| 2918 | 95 | Windows 95 | |
| 1448 | 60 | Windows 98 | |
| 1817 | 36 | Unknown Windows | |
| 559 | 9 | Windows 3.1 | |
| 514 | 5 | Windows CE | |
| 4 | 6071 | 325 | Macintosh |
| 5 | 1797 | 196 | Unix |
| 1629 | 162 | Linux | |
| 156 | 30 | FreeBSD | |
| 11 | 3 | SunOS | |
| 1 | 1 | OpenBSD | |
| 6 | 77 | 1 | Symbian OS |
| 7 | 2 | 0 | OpenVMS |
| 8 | 2 | 0 | Amiga |
(Go To: Top | General Summary | Monthly Report | Daily Summary | Hourly Summary | Domain Report | Organisation Report | Search Word Report | Operating System Report | Status Code Report | File Size Report | File Type Report | Directory Report)
This report lists the HTTP status codes of all requests.
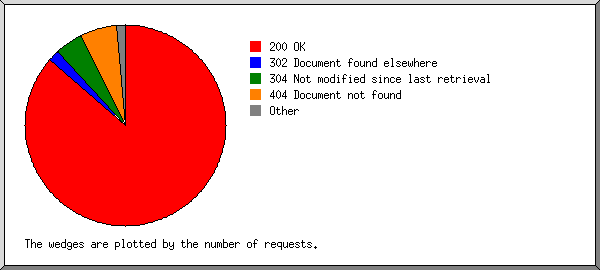
Listing status codes, sorted numerically.
| reqs | status code |
|---|---|
| 318409 | 200 OK |
| 26 | 206 Partial content |
| 3221 | 301 Document moved permanently |
| 6197 | 302 Document found elsewhere |
| 16626 | 304 Not modified since last retrieval |
| 292 | 400 Bad request |
| 32 | 403 Access forbidden |
| 22178 | 404 Document not found |
| 71 | 408 Request timeout |
| 1277 | 500 Internal server error |
(Go To: Top | General Summary | Monthly Report | Daily Summary | Hourly Summary | Domain Report | Organisation Report | Search Word Report | Operating System Report | Status Code Report | File Size Report | File Type Report | Directory Report)
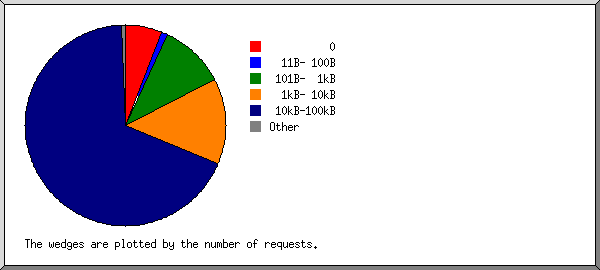
This report lists the sizes of files.
| size | reqs | %bytes |
|---|---|---|
| 0 | 20154 | |
| 1B- 10B | 13 | |
| 11B- 100B | 3358 | |
| 101B- 1kB | 35317 | 0.21% |
| 1kB- 10kB | 46268 | 2.83% |
| 10kB-100kB | 228012 | 89.57% |
| 100kB- 1MB | 1823 | 4.68% |
| 1MB- 10MB | 116 | 2.70% |
(Go To: Top | General Summary | Monthly Report | Daily Summary | Hourly Summary | Domain Report | Organisation Report | Search Word Report | Operating System Report | Status Code Report | File Size Report | File Type Report | Directory Report)
This report lists the extensions of files.
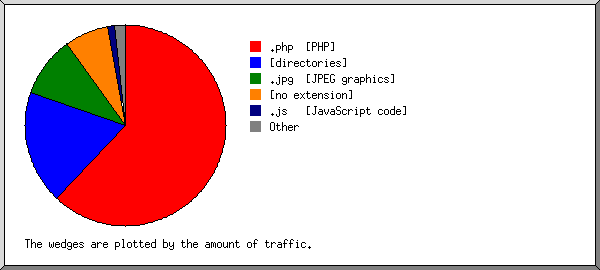
Listing extensions with at least 0.1% of the traffic, sorted by the amount of traffic.
| reqs | %bytes | extension |
|---|---|---|
| 171582 | 61.91% | .php [PHP] |
| 63955 | 18.31% | [directories] |
| 14558 | 9.87% | .jpg [JPEG graphics] |
| 27897 | 7.05% | [no extension] |
| 6201 | 1.13% | .js [JavaScript code] |
| 13 | 0.58% | .mp3 [MP3 sound files] |
| 8929 | 0.53% | .css [Cascading Style Sheets] |
| 39076 | 0.24% | .gif [GIF graphics] |
| 1323 | 0.16% | .default |
| 24 | 0.14% | .jar |
| 1501 | 0.06% | [not listed: 24 extensions] |
(Go To: Top | General Summary | Monthly Report | Daily Summary | Hourly Summary | Domain Report | Organisation Report | Search Word Report | Operating System Report | Status Code Report | File Size Report | File Type Report | Directory Report)
This report lists the directories from which files were requested. (The figures for each directory include all of its subdirectories.)
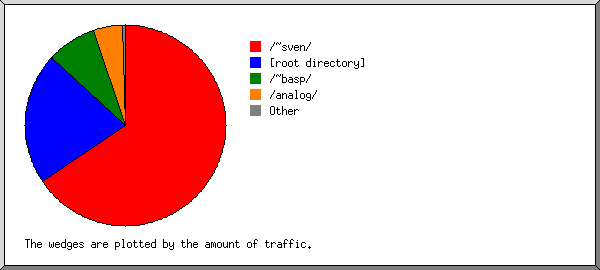
Listing directories with at least 0.01% of the traffic, sorted by the amount of traffic.
| reqs | %bytes | directory |
|---|---|---|
| 181594 | 65.44% | /~sven/ |
| 92704 | 21.31% | [root directory] |
| 44611 | 8.08% | /~basp/ |
| 10072 | 4.79% | /analog/ |
| 20 | 0.13% | /ssh/ |
| 2099 | 0.10% | /images/ |
| 306 | 0.06% | http:// |
| 3544 | 0.05% | /themes/ |
| 63 | 0.02% | /index.php/ |
| 46 | 0.01% | [not listed: 2 directories] |