 Web Server Statistics for freegw.xs4all.nl
 Web Server Statistics for freegw.xs4all.nl
(Go To: Top: General Summary: Monthly Report: Daily Summary: Hourly Summary: Domain Report: Organisation Report: Operating System Report: Status Code Report: File Size Report: File Type Report: Directory Report)
This report contains overall statistics.
(Figures in parentheses refer to the 7-day period ending
01-Jan-2005 03:04).
Successful requests: 99,357 (5,411)
Average successful requests per day: 833 (772)
Successful requests for pages: 9,552 (1,073)
Average successful requests for pages per day: 80 (153)
Failed requests: 19,653 (786)
Redirected requests: 4,789 (406)
Distinct files requested: 2,557 (810)
Distinct hosts served: 2,742 (385)
Corrupt logfile lines: 188
Unwanted logfile entries: 504,197
Data transferred: 781.15 megabytes (51.86 megabytes)
Average data transferred per day: 6.56 megabytes (7.41 megabytes)
(Go To: Top: General Summary: Monthly Report: Daily Summary: Hourly Summary: Domain Report: Organisation Report: Operating System Report: Status Code Report: File Size Report: File Type Report: Directory Report)
This report lists the activity in each month.
Each unit ( ) represents 80 requests
for pages or part thereof.
month: reqs: pages: --------: -----: -----: Sep 2004: 31231: 2201:Busiest month: Nov 2004 (2,982 requests for pages).Oct 2004: 23771: 1407:
Nov 2004: 22093: 2982:
Dec 2004: 22204: 2928:
Jan 2005: 58: 34:

(Go To: Top: General Summary: Monthly Report: Daily Summary: Hourly Summary: Domain Report: Organisation Report: Operating System Report: Status Code Report: File Size Report: File Type Report: Directory Report)
This report lists the total activity for each day of the week, summed over all the weeks in the report.
Each unit ( ) represents 40 requests
for pages or part thereof.
day: reqs: pages: ---: -----: -----: Sun: 15614: 1303:Mon: 14246: 1283:
Tue: 15586: 1321:
Wed: 14115: 1182:
Thu: 12700: 1687:
Fri: 12674: 1373:
Sat: 14422: 1403:

(Go To: Top: General Summary: Monthly Report: Daily Summary: Hourly Summary: Domain Report: Organisation Report: Operating System Report: Status Code Report: File Size Report: File Type Report: Directory Report)
This report lists the total activity for each hour of the day, summed over all the days in the report.
Each unit ( ) represents 20 requests
for pages or part thereof.
hour: reqs: pages: ----: ----: -----: 0: 3142: 627:1: 1882: 338:
2: 1522: 264:
3: 2158: 330:
4: 1333: 301:
5: 1863: 295:
6: 1464: 327:
7: 1775: 243:
8: 2933: 370:
9: 4131: 331:
10: 3245: 350:
11: 4394: 327:
12: 4241: 303:
13: 3614: 305:
14: 5555: 388:
15: 5516: 356:
16: 5452: 532:
17: 5533: 461:
18: 5747: 408:
19: 6411: 559:
20: 8035: 578:
21: 7209: 372:
22: 6773: 476:
23: 5429: 711:

(Go To: Top: General Summary: Monthly Report: Daily Summary: Hourly Summary: Domain Report: Organisation Report: Operating System Report: Status Code Report: File Size Report: File Type Report: Directory Report)
This report lists the countries of the computers which requested files.
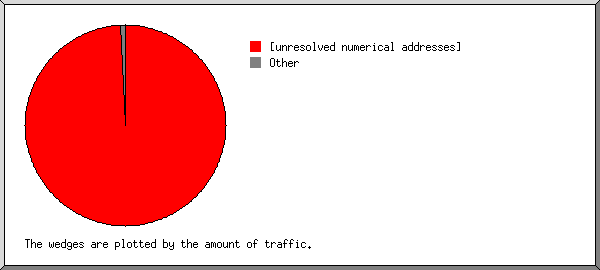
Listing domains, sorted by the amount of traffic.
 reqs: %bytes: domain
-----: ------: ------
98414: 99.35%: [unresolved numerical addresses]
  935:  0.65%: [domain not given]
    8:       : .nl (Netherlands)
(Go To: Top: General Summary: Monthly Report: Daily Summary: Hourly Summary: Domain Report: Organisation Report: Operating System Report: Status Code Report: File Size Report: File Type Report: Directory Report)
This report lists the organisations of the computers which requested files.
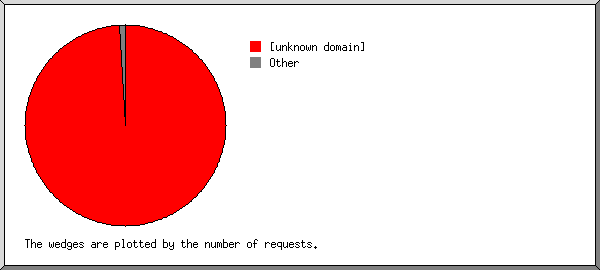
Listing organisations, sorted by the number of requests.
 reqs: %bytes: organisation
-----: ------: ------------
98414: 99.35%: [unknown domain]
  935:  0.65%: [domain not given]
    8:       : xs4all.nl
(Go To: Top: General Summary: Monthly Report: Daily Summary: Hourly Summary: Domain Report: Organisation Report: Operating System Report: Status Code Report: File Size Report: File Type Report: Directory Report)
This report lists the operating systems used by visitors.
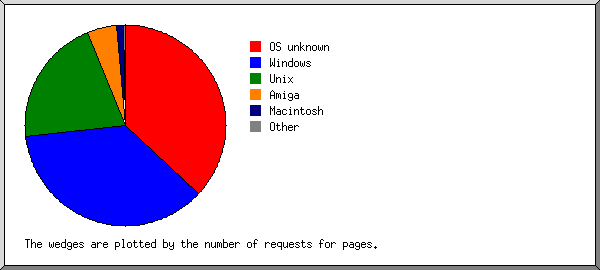
Listing operating systems, sorted by the number of requests for pages.
no.:  reqs: pages: OS
---: -----: -----: --
  1: 23878:  3491: OS unknown
  2: 70998:  3419: Windows
   : 51064:  2244:   Windows XP
   :  9561:   822:   Windows 2000
   :  8096:   233:   Windows 98
   :  1734:    55:   Windows ME
   :   304:    30:   Windows NT
   :   107:    27:   Unknown Windows
   :   132:     8:   Windows 95
  3:  3265:  1964: Unix
   :  2357:  1507:   Linux
   :   662:   324:   Other Unix
   :   204:   122:   FreeBSD
   :    36:    11:   OpenBSD
   :     6:     0:   NetBSD
  4:   443:   442: Amiga
  5:   559:   106: Macintosh
  6:    22:    22: Atari
(Go To: Top: General Summary: Monthly Report: Daily Summary: Hourly Summary: Domain Report: Organisation Report: Operating System Report: Status Code Report: File Size Report: File Type Report: Directory Report)
This report lists the HTTP status codes of all requests.
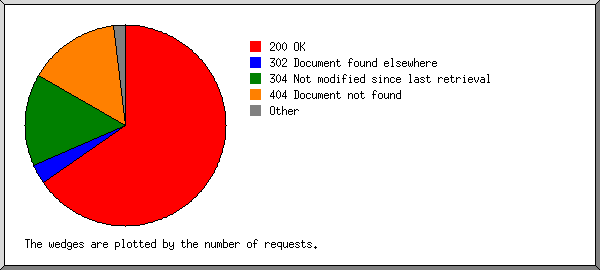
Listing status codes, sorted numerically.
 reqs: status code
-----: -----------
80773: 200 OK
   41: 206 Partial content
 1021: 301 Document moved permanently
 3768: 302 Document found elsewhere
18543: 304 Not modified since last retrieval
  405: 400 Bad request
   94: 401 Authentication required
  664: 403 Access forbidden
18452: 404 Document not found
    3: 405 Method not allowed
    4: 408 Request timeout
   19: 500 Internal server error
   12: 501 Request type not supported
(Go To: Top: General Summary: Monthly Report: Daily Summary: Hourly Summary: Domain Report: Organisation Report: Operating System Report: Status Code Report: File Size Report: File Type Report: Directory Report)
This report lists the sizes of files.

       size:  reqs: %bytes:
-----------: -----: ------:
          0: 18103:       :
   1B-  10B:    19:       :
  11B- 100B:  2199:  0.02%:
 101B-  1kB: 23577:  0.89%:
  1kB- 10kB: 26540: 15.37%:
 10kB-100kB: 28211: 70.40%:
100kB-  1MB:   707: 13.12%:
  1MB- 10MB:     1:  0.19%:
(Go To: Top: General Summary: Monthly Report: Daily Summary: Hourly Summary: Domain Report: Organisation Report: Operating System Report: Status Code Report: File Size Report: File Type Report: Directory Report)
This report lists the extensions of files.
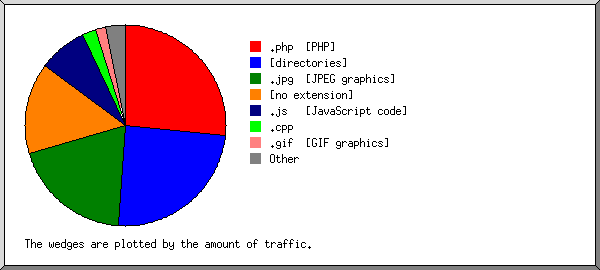
Listing extensions with at least 0.1% of the traffic, sorted by the amount of traffic.
 reqs: %bytes: extension
-----: ------: ---------
23993: 26.65%: .php  [PHP]
 9542: 24.39%: [directories]
 8098: 19.41%: .jpg  [JPEG graphics]
 6998: 14.61%: [no extension]
 5588:  7.89%: .js   [JavaScript code]
  563:  2.34%: .cpp
38394:  1.64%: .gif  [GIF graphics]
   19:  0.93%: .jar  [Compressed file archives]
 4243:  0.83%: .css  [Cascading Style Sheets]
   71:  0.31%: .diff
    6:  0.29%: .cab  [Cabinet files/ Install Shield Compressed file archives]
  192:  0.24%: .h
 1407:  0.16%: .png  [PNG graphics]
  243:  0.30%: [not listed: 29 extensions]
(Go To: Top: General Summary: Monthly Report: Daily Summary: Hourly Summary: Domain Report: Organisation Report: Operating System Report: Status Code Report: File Size Report: File Type Report: Directory Report)
This report lists the directories from which files were requested. (The figures for each directory include all of its subdirectories.)
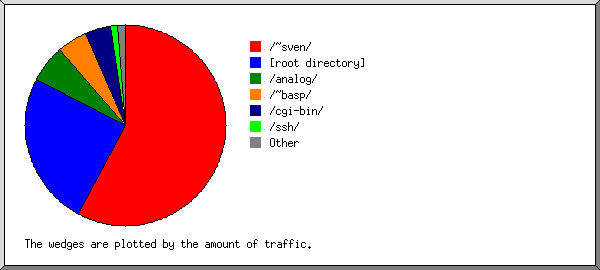
Listing directories with at least 0.01% of the traffic, sorted by the amount of traffic.
 reqs: %bytes: directory
-----: ------: ---------
69599: 57.74%: /~sven/
11361: 24.84%: [root directory]
 1929:  5.97%: /analog/
 8050:  4.95%: /~basp/
 1756:  4.22%: /cgi-bin/
   20:  1.16%: /ssh/
 2192:  0.70%: /images/
  833:  0.17%: /themes/
   50:  0.13%: [no directory]
   10:  0.03%: http://
  770:  0.03%: /css/
 2732:  0.02%: /icons/
   18:  0.02%: /comments/
    9:  0.01%: /manual/
   28:  0.02%: [not listed: 7 directories]
(Go To: Top: General Summary: Monthly Report: Daily Summary: Hourly Summary: Domain Report: Organisation Report: Operating System Report: Status Code Report: File Size Report: File Type Report: Directory Report)