 Web Server Statistics for freegw.xs4all.nl Web Server Statistics for freegw.xs4all.nl
(Go To: Top: General Summary: Monthly Report: Daily Summary: Hourly Summary: Domain Report: Organisation Report: Operating System Report: Status Code Report: File Size Report: File Type Report: Directory Report)
This report contains overall statistics.
(Figures in parentheses refer to the 7-day period ending
01-Oct-2004 03:04).
Successful requests: 31,318 (6,482)
Average successful requests per day: 1,153 (925)
Successful requests for pages: 2,208 (347)
Average successful requests for pages per day: 81 (49)
Failed requests: 2,086 (375)
Redirected requests: 605 (187)
Distinct files requested: 1,575 (929)
Distinct hosts served: 737 (271)
Corrupt logfile lines: 40
Unwanted logfile entries: 9,931
Data transferred: 213.89 megabytes (42.57 megabytes)
Average data transferred per day: 7.88 megabytes (6.08 megabytes)
(Go To: Top: General Summary: Monthly Report: Daily Summary: Hourly Summary: Domain Report: Organisation Report: Operating System Report: Status Code Report: File Size Report: File Type Report: Directory Report)
This report lists the activity in each month.
Each unit ( ) represents 60 requests
for pages or part thereof.
) represents 60 requests
for pages or part thereof.
month: reqs: pages: --------: -----: -----: Sep 2004: 31231: 2201:Busiest month: Sep 2004 (2,201 requests for pages).
(Go To: Top: General Summary: Monthly Report: Daily Summary: Hourly Summary: Domain Report: Organisation Report: Operating System Report: Status Code Report: File Size Report: File Type Report: Directory Report)
This report lists the total activity for each day of the week, summed over all the weeks in the report.
Each unit () represents 10 requests
for pages or part thereof.
day: reqs: pages: ---: ----: -----: Sun: 4340: 432:Mon: 4548: 324:
Sat: 5318: 314:

(Go To: Top: General Summary: Monthly Report: Daily Summary: Hourly Summary: Domain Report: Organisation Report: Operating System Report: Status Code Report: File Size Report: File Type Report: Directory Report)
This report lists the total activity for each hour of the day, summed over all the days in the report.
Each unit () represents 5 requests
for pages or part thereof.
hour: reqs: pages: ----: ----: -----: 0: 791: 108:18: 1959: 84:
(Go To: Top: General Summary: Monthly Report: Daily Summary: Hourly Summary: Domain Report: Organisation Report: Operating System Report: Status Code Report: File Size Report: File Type Report: Directory Report)
This report lists the countries of the computers which requested files.
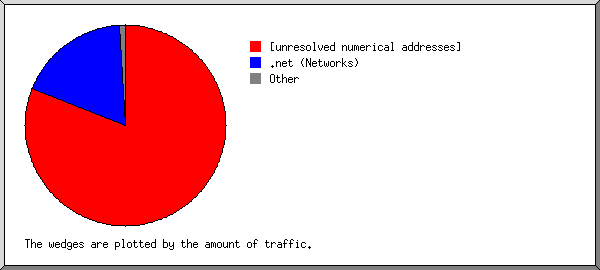
Listing domains, sorted by the amount of traffic.
 reqs: %bytes: domain
-----: ------: ------
30439: 97.83%: [unresolved numerical addresses]
  879:  2.17%: [domain not given]
(Go To: Top: General Summary: Monthly Report: Daily Summary: Hourly Summary: Domain Report: Organisation Report: Operating System Report: Status Code Report: File Size Report: File Type Report: Directory Report)
This report lists the organisations of the computers which requested files.
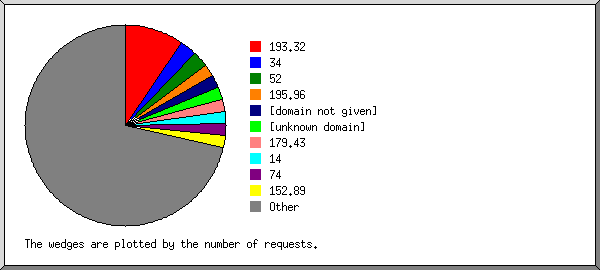
Listing organisations, sorted by the number of requests.
 reqs: %bytes: organisation
-----: ------: ------------
30439: 97.83%: [unknown domain]
  879:  2.17%: [domain not given]
(Go To: Top: General Summary: Monthly Report: Daily Summary: Hourly Summary: Domain Report: Organisation Report: Operating System Report: Status Code Report: File Size Report: File Type Report: Directory Report)
This report lists the operating systems used by visitors.
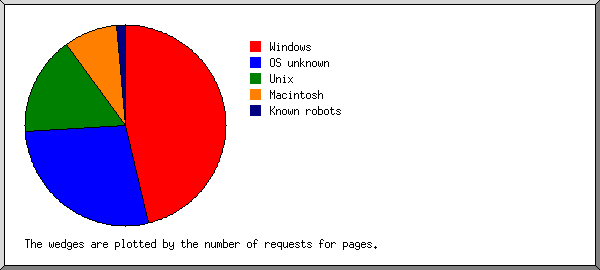
Listing operating systems, sorted by the number of requests for pages.
no.:  reqs: pages: OS
---: -----: -----: --
  1: 26011:  1271: Windows
   : 16376:   825:   Windows XP
   :  4906:   365:   Windows 2000
   :  3459:    54:   Windows 98
   :  1107:    22:   Windows ME
   :   126:     3:   Windows NT
   :    37:     2:   Unknown Windows
  2:  4591:   849: OS unknown
  3:   359:    62: Unix
   :   320:    42:   Linux
   :    38:    19:   FreeBSD
   :     1:     1:   Other Unix
  4:   301:    10: Macintosh
  5:     3:     3: Amiga
(Go To: Top: General Summary: Monthly Report: Daily Summary: Hourly Summary: Domain Report: Organisation Report: Operating System Report: Status Code Report: File Size Report: File Type Report: Directory Report)
This report lists the HTTP status codes of all requests.
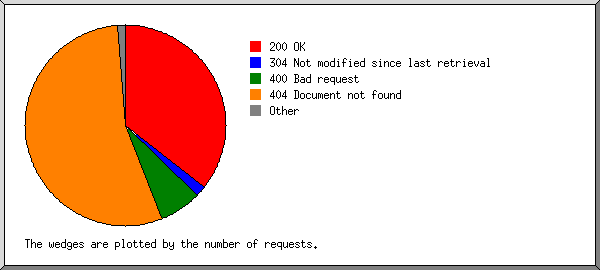
Listing status codes, sorted numerically.
 reqs: status code
-----: -----------
23202: 200 OK
   13: 206 Partial content
  248: 301 Document moved permanently
  357: 302 Document found elsewhere
 8103: 304 Not modified since last retrieval
    4: 400 Bad request
   90: 401 Authentication required
  240: 403 Access forbidden
 1735: 404 Document not found
    2: 408 Request timeout
   15: 500 Internal server error
(Go To: Top: General Summary: Monthly Report: Daily Summary: Hourly Summary: Domain Report: Organisation Report: Operating System Report: Status Code Report: File Size Report: File Type Report: Directory Report)
This report lists the sizes of files.
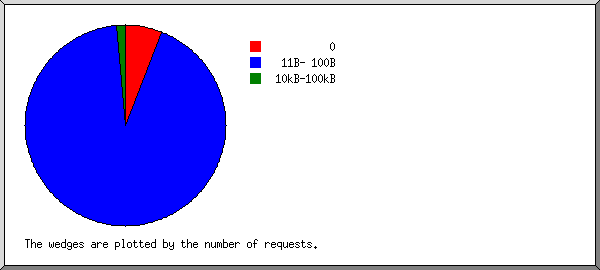
       size: reqs: %bytes:
-----------: ----: ------:
          0: 7992:       :
   1B-  10B:    4:       :
  11B- 100B:  665:  0.02%:
 101B-  1kB: 7927:  1.09%:
  1kB- 10kB: 7888: 16.88%:
 10kB-100kB: 6580: 63.48%:
100kB-  1MB:  261: 17.83%:
  1MB- 10MB:    1:  0.70%:
(Go To: Top: General Summary: Monthly Report: Daily Summary: Hourly Summary: Domain Report: Organisation Report: Operating System Report: Status Code Report: File Size Report: File Type Report: Directory Report)
This report lists the extensions of files.
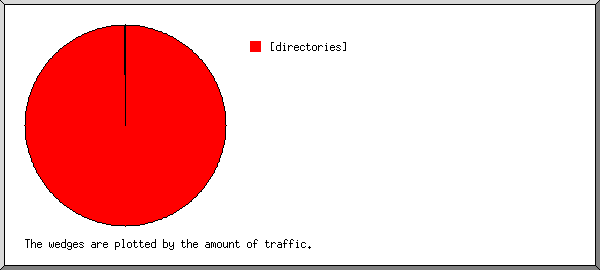
Listing extensions with at least 0.1% of the traffic, sorted by the amount of traffic.
 reqs: %bytes: extension
-----: ------: ---------
 6205: 25.72%: .php  [PHP]
 3053: 22.43%: .jpg  [JPEG graphics]
 2205: 20.41%: [directories]
 1902:  9.56%: .js   [JavaScript code]
 1107:  9.48%: [no extension]
  466:  5.92%: .cpp
14016:  1.97%: .gif  [GIF graphics]
    8:  0.99%: .jar  [Compressed file archives]
   47:  0.96%: .diff
 1707:  0.95%: .css  [Cascading Style Sheets]
  150:  0.53%: .h
    3:  0.53%: .cab  [Cabinet files/ Install Shield Compressed file archives]
   14:  0.13%: .nl
  364:  0.12%: .png  [PNG graphics]
   71:  0.30%: [not listed: 18 extensions]
(Go To: Top: General Summary: Monthly Report: Daily Summary: Hourly Summary: Domain Report: Organisation Report: Operating System Report: Status Code Report: File Size Report: File Type Report: Directory Report)
This report lists the directories from which files were requested. (The figures for each directory include all of its subdirectories.)
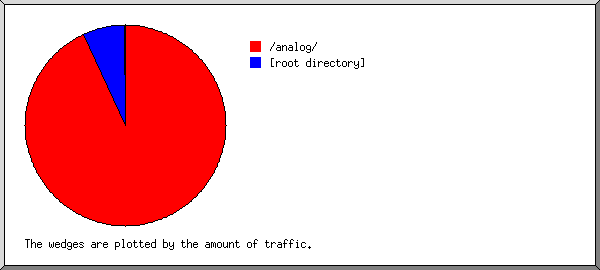
Listing directories with at least 0.01% of the traffic, sorted by the amount of traffic.
 reqs: %bytes: directory
-----: ------: ---------
22180: 60.73%: /~sven/
 2125: 13.81%: [root directory]
 1330: 10.91%: /cgi-bin/
  939: 10.89%: /analog/
    8:  1.32%: /ssh/
 1005:  1.16%: /~basp/
 1115:  0.70%: /images/
  490:  0.20%: /themes/
   19:  0.18%: [no directory]
  509:  0.04%: /css/
 1593:  0.03%: /icons/
    2:  0.02%: http://
    3:  0.01%: /manual/
(Go To: Top: General Summary: Monthly Report: Daily Summary: Hourly Summary: Domain Report: Organisation Report: Operating System Report: Status Code Report: File Size Report: File Type Report: Directory Report)

