 Web Server Statistics for freegw.xs4all.nl
 Web Server Statistics for freegw.xs4all.nl
(Go To: Top: General Summary: Monthly Report: Daily Summary: Hourly Summary: Domain Report: Organisation Report: Operating System Report: Status Code Report: File Size Report: File Type Report: Directory Report)
This report contains overall statistics.
(Figures in parentheses refer to the 7-day period ending
01-Aug-2004 03:09).
Successful requests: 74,702 (4,117)
Average successful requests per day: 836 (588)
Successful requests for pages: 3,727 (104)
Average successful requests for pages per day: 41 (14)
Failed requests: 2,911 (387)
Redirected requests: 319 (14)
Distinct files requested: 1,565 (327)
Distinct hosts served: 2,636 (167)
Corrupt logfile lines: 432
Unwanted logfile entries: 58,225
Data transferred: 447.07 megabytes (24.07 megabytes)
Average data transferred per day: 5.00 megabytes (3.44 megabytes)
(Go To: Top: General Summary: Monthly Report: Daily Summary: Hourly Summary: Domain Report: Organisation Report: Operating System Report: Status Code Report: File Size Report: File Type Report: Directory Report)
This report lists the activity in each month.
Each unit ( ) represents 50 requests
for pages or part thereof.
month: reqs: pages: --------: -----: -----: May 2004: 20653: 1786:Busiest month: May 2004 (1,786 requests for pages).Jun 2004: 30061: 1204:
Jul 2004: 23924: 736:
Aug 2004: 64: 1:

(Go To: Top: General Summary: Monthly Report: Daily Summary: Hourly Summary: Domain Report: Organisation Report: Operating System Report: Status Code Report: File Size Report: File Type Report: Directory Report)
This report lists the total activity for each day of the week, summed over all the weeks in the report.
Each unit ( ) represents 15 requests
for pages or part thereof.
day: reqs: pages: ---: -----: -----: Sun: 12308: 447:Mon: 12680: 540:
Tue: 11567: 488:
Wed: 12207: 657:
Thu: 9286: 532:
Fri: 8687: 594:
Sat: 7967: 469:

(Go To: Top: General Summary: Monthly Report: Daily Summary: Hourly Summary: Domain Report: Organisation Report: Operating System Report: Status Code Report: File Size Report: File Type Report: Directory Report)
This report lists the total activity for each hour of the day, summed over all the days in the report.
Each unit ( ) represents 6 requests
for pages or part thereof.
hour: reqs: pages: ----: ----: -----: 0: 2575: 136:1: 2192: 133:
2: 859: 91:
3: 691: 101:
4: 656: 114:
5: 1315: 156:
6: 1695: 146:
7: 910: 134:
8: 1527: 132:
9: 2726: 153:
10: 2437: 175:
11: 4169: 157:
12: 3567: 171:
13: 2743: 179:
14: 4355: 236:
15: 5265: 184:
16: 2970: 183:
17: 4378: 179:
18: 5664: 165:
19: 5762: 138:
20: 4117: 154:
21: 4609: 176:
22: 4971: 171:
23: 4549: 163:

(Go To: Top: General Summary: Monthly Report: Daily Summary: Hourly Summary: Domain Report: Organisation Report: Operating System Report: Status Code Report: File Size Report: File Type Report: Directory Report)
This report lists the countries of the computers which requested files.
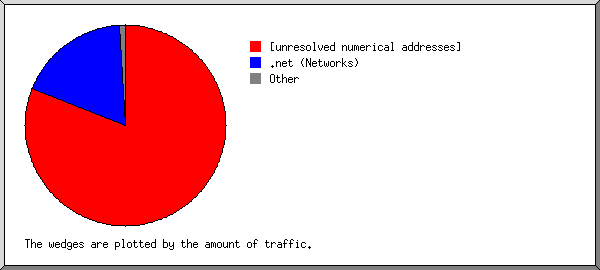
Listing domains, sorted by the amount of traffic.
 reqs: %bytes: domain
-----: ------: ------
34072: 37.23%: .nl (Netherlands)
 8581: 17.24%: [unresolved numerical addresses]
 5875: 13.78%: .com (Commercial)
 7853: 10.86%: .net (Networks)
 5758:  6.18%: .be (Belgium)
 4711:  5.25%: .fr (France)
 1671:  1.94%: .ca (Canada)
 1423:  1.67%: .jp (Japan)
  901:  1.36%: .de (Germany)
 1704:  1.26%: .pt (Portugal)
  464:  0.62%: .dk (Denmark)
  329:  0.53%: .it (Italy)
  293:  0.51%: .uk (United Kingdom)
  283:  0.31%: .ch (Switzerland)
  118:  0.15%: .at (Austria)
   61:  0.11%: .hu (Hungary)
   62:  0.10%: .es (Spain)
   22:  0.09%: .edu (USA Higher Education)
   63:  0.09%: .au (Australia)
   35:  0.07%: [domain not given]
   67:  0.06%: .br (Brazil)
   30:  0.06%: .pl (Poland)
   34:  0.04%: .org (Non Profit Making Organisations)
    9:  0.04%: .co (Colombia)
    9:  0.04%: .hk (Hong Kong)
   34:  0.03%: .se (Sweden)
   13:  0.03%: .ar (Argentina)
   10:  0.03%: .tw (Taiwan)
   27:  0.03%: .cy (Cyprus)
   29:  0.03%: .mx (Mexico)
   10:  0.03%: .il (Israel)
   26:  0.03%: .cl (Chile)
   19:  0.02%: .do (Dominican Republic)
   11:  0.02%: .ee (Estonia)
    4:  0.02%: .us (United States)
   25:  0.02%: .fi (Finland)
    7:  0.01%: .si (Slovenia)
   15:  0.01%: .ru (Russia)
    8:  0.01%: .id (Indonesia)
    7:  0.01%: .lt (Lithuania)
    2:  0.01%: .kr (South Korea)
    2:  0.01%: .cz (Czech Republic)
    2:  0.01%: [unknown domain]
    2:  0.01%: .tr (Turkey)
    8:  0.01%: .ua (Ukraine)
    4:  0.01%: .za (South Africa)
    2:  0.01%: .info (Informational)
    1:       : .ma (Morocco)
    1:       : .cn (China)
    1:       : .sg (Singapore)
    1:       : .no (Norway)
    3:       : .arpa (Arpanet)
(Go To: Top: General Summary: Monthly Report: Daily Summary: Hourly Summary: Domain Report: Organisation Report: Operating System Report: Status Code Report: File Size Report: File Type Report: Directory Report)
This report lists the organisations of the computers which requested files.
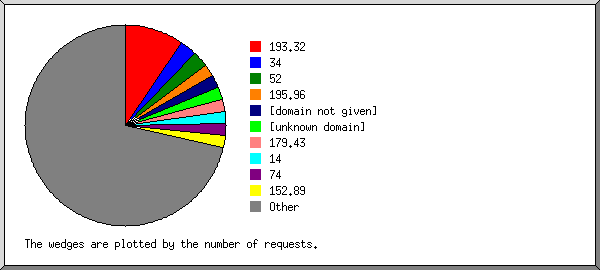
Listing the top 20 organisations by the number of requests, sorted by the number of requests.
 reqs: %bytes: organisation
-----: ------: ------------
 4659:  3.02%: planet.nl
 4342:  4.67%: wanadoo.nl
 4168:  2.57%: tiscali.nl
 3568:  3.77%: hetnet.nl
 3354:  2.76%: kabel.telenet.be
 3161:  3.07%: wanadoo.fr
 2681:  3.31%: chello.nl
 2532:  4.74%: xs4all.nl
 2425:  3.36%: home.nl
 2175:  2.75%: zeelandnet.nl
 1629:  0.99%: surf.net
 1542:  2.56%: adsl.skynet.be
 1365:  3.88%: msn.com
 1166:  1.20%: sympatico.ca
 1104:  0.96%: bbtec.net
 1066:  2.45%: 80.69
 1018:  0.75%: a2000.nl
  987:  0.60%: ip.pt
  961:  3.07%: 66.180
  935:  0.76%: quicknet.nl
29864: 48.76%: [not listed: 862 organisations]
(Go To: Top: General Summary: Monthly Report: Daily Summary: Hourly Summary: Domain Report: Organisation Report: Operating System Report: Status Code Report: File Size Report: File Type Report: Directory Report)
This report lists the operating systems used by visitors.
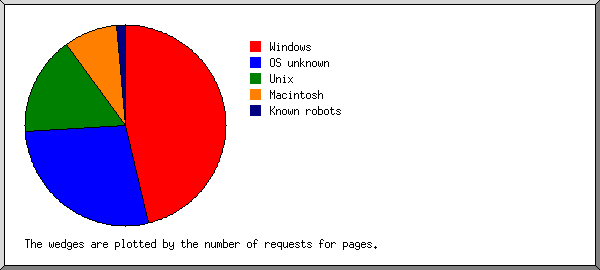
Listing operating systems, sorted by the number of requests for pages.
no.:  reqs: pages: OS
---: -----: -----: --
  1: 62759:  1999: Windows
   : 13508:  1233:   Windows 98
   : 37914:   599:   Windows XP
   :  7192:    92:   Windows 2000
   :  3611:    42:   Windows ME
   :   386:    16:   Windows NT
   :    93:    10:   Windows 95
   :    51:     6:   Unknown Windows
   :     4:     1:   Windows CE
  2:  8826:  1599: OS unknown
  3:  1890:    90: Unix
   :  1856:    85:   Linux
   :    34:     5:   FreeBSD
  4:   727:    18: Macintosh
(Go To: Top: General Summary: Monthly Report: Daily Summary: Hourly Summary: Domain Report: Organisation Report: Operating System Report: Status Code Report: File Size Report: File Type Report: Directory Report)
This report lists the HTTP status codes of all requests.
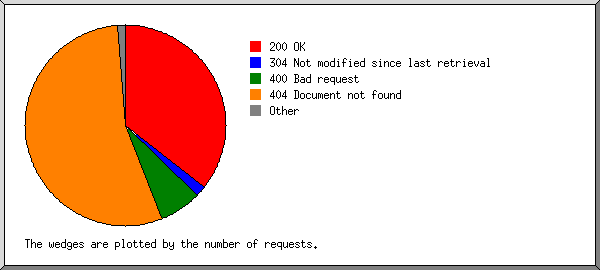
Listing status codes, sorted numerically.
 reqs: status code
-----: -----------
56703: 200 OK
   33: 206 Partial content
  251: 301 Document moved permanently
   68: 302 Document found elsewhere
17966: 304 Not modified since last retrieval
   14: 400 Bad request
    1: 403 Access forbidden
 2876: 404 Document not found
   14: 408 Request timeout
    6: 501 Request type not supported
(Go To: Top: General Summary: Monthly Report: Daily Summary: Hourly Summary: Domain Report: Organisation Report: Operating System Report: Status Code Report: File Size Report: File Type Report: Directory Report)
This report lists the sizes of files.
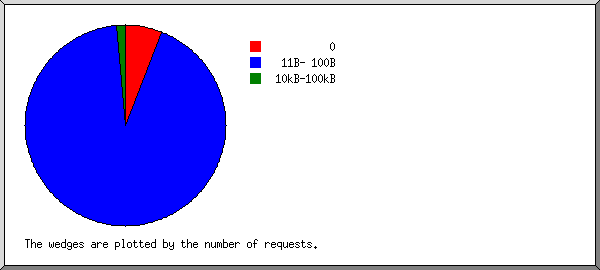
       size:  reqs: %bytes:
-----------: -----: ------:
          0: 18051:       :
   1B-  10B:     0:       :
  11B- 100B:  3296:  0.04%:
 101B-  1kB: 20939:  1.40%:
  1kB- 10kB: 16797: 18.05%:
 10kB-100kB: 15011: 61.29%:
100kB-  1MB:   608: 19.23%:
(Go To: Top: General Summary: Monthly Report: Daily Summary: Hourly Summary: Domain Report: Organisation Report: Operating System Report: Status Code Report: File Size Report: File Type Report: Directory Report)
This report lists the extensions of files.
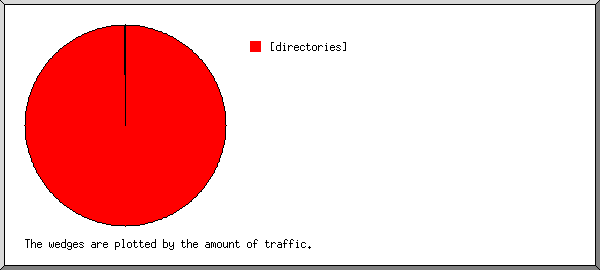
Listing extensions with at least 0.1% of the traffic, sorted by the amount of traffic.
 reqs: %bytes: extension
-----: ------: ---------
 7023: 33.37%: .jpg  [JPEG graphics]
15632: 29.64%: .php  [PHP files]
 5854: 12.86%: .js   [JavaScript code]
 3723: 12.57%: [directories]
 1557:  4.38%: [no extension]
38074:  2.50%: .gif  [GIF graphics]
   87:  2.13%: .exe  [Executables]
 2358:  1.10%: .css  [Cascading Style Sheets]
    9:  1.01%: .jar  [Java archives]
    3:  0.25%: .cab  [Cabinet files]
  382:  0.18%: [not listed: 15 extensions]
(Go To: Top: General Summary: Monthly Report: Daily Summary: Hourly Summary: Domain Report: Organisation Report: Operating System Report: Status Code Report: File Size Report: File Type Report: Directory Report)
This report lists the directories from which files were requested. (The figures for each directory include all of its subdirectories.)
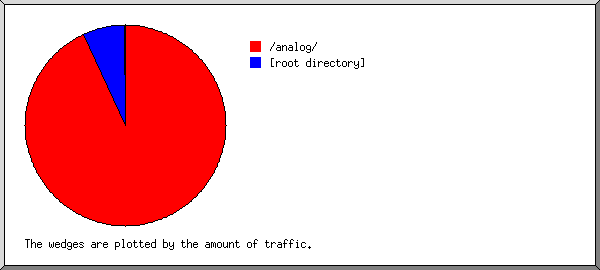
Listing directories with at least 0.01% of the traffic, sorted by the amount of traffic.
 reqs: %bytes: directory
-----: ------: ---------
61453: 67.46%: /~sven/
 7642: 18.30%: /~basp/
 4153: 10.98%: [root directory]
   12:  1.27%: /ssh/
  249:  1.00%: /analog/
  432:  0.34%: /images/
  200:  0.14%: /themes/
   64:  0.06%: /cgi-bin/
   15:  0.06%: [no directory]
   20:  0.03%: http://
   17:  0.01%: [not listed: 3 directories]
(Go To: Top: General Summary: Monthly Report: Daily Summary: Hourly Summary: Domain Report: Organisation Report: Operating System Report: Status Code Report: File Size Report: File Type Report: Directory Report)