 Web Server Statistics for freegw.xs4all.nl Web Server Statistics for freegw.xs4all.nl
(Go To: Top: General Summary: Monthly Report: Daily Summary: Hourly Summary: Domain Report: Organisation Report: Operating System Report: Status Code Report: File Size Report: File Type Report: Directory Report)
This report contains overall statistics.
(Figures in parentheses refer to the 7-day period ending
01-Jun-2004 03:07).
Successful requests: 20,790 (6,023)
Average successful requests per day: 733 (860)
Successful requests for pages: 1,791 (482)
Average successful requests for pages per day: 63 (68)
Failed requests: 646 (114)
Redirected requests: 151 (29)
Distinct files requested: 974 (433)
Distinct hosts served: 1,430 (412)
Corrupt logfile lines: 206
Unwanted logfile entries: 5,150
Data transferred: 131.43 megabytes (34.13 megabytes)
Average data transferred per day: 4.64 megabytes (4.88 megabytes)
(Go To: Top: General Summary: Monthly Report: Daily Summary: Hourly Summary: Domain Report: Organisation Report: Operating System Report: Status Code Report: File Size Report: File Type Report: Directory Report)
This report lists the activity in each month.
Each unit ( ) represents 50 requests
for pages or part thereof.
) represents 50 requests
for pages or part thereof.
month: reqs: pages: --------: -----: -----: May 2004: 20653: 1786:Busiest month: May 2004 (1,786 requests for pages).Jun 2004: 137: 5:
(Go To: Top: General Summary: Monthly Report: Daily Summary: Hourly Summary: Domain Report: Organisation Report: Operating System Report: Status Code Report: File Size Report: File Type Report: Directory Report)
This report lists the total activity for each day of the week, summed over all the weeks in the report.
Each unit () represents 8 requests
for pages or part thereof.
day: reqs: pages: ---: ----: -----: Sun: 2871: 188:Mon: 4490: 272:
Tue: 2339: 274:
(Go To: Top: General Summary: Monthly Report: Daily Summary: Hourly Summary: Domain Report: Organisation Report: Operating System Report: Status Code Report: File Size Report: File Type Report: Directory Report)
This report lists the total activity for each hour of the day, summed over all the days in the report.
Each unit () represents 4 requests
for pages or part thereof.
hour: reqs: pages: ----: ----: -----: 0: 734: 65:8: 376: 42:
(Go To: Top: General Summary: Monthly Report: Daily Summary: Hourly Summary: Domain Report: Organisation Report: Operating System Report: Status Code Report: File Size Report: File Type Report: Directory Report)
This report lists the countries of the computers which requested files.
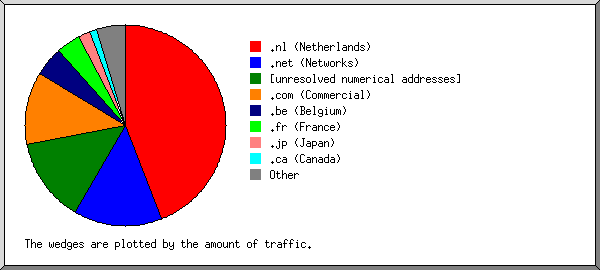
Listing domains, sorted by the amount of traffic.
 reqs: %bytes: domain
-----: ------: ------
11284: 44.07%: .nl (Netherlands)
 2133: 14.17%: .net (Networks)
 2230: 13.65%: [unresolved numerical addresses]
 1481: 11.70%: .com (Commercial)
 1347:  4.83%: .be (Belgium)
  991:  3.86%: .fr (France)
  231:  1.94%: .jp (Japan)
  242:  1.22%: .ca (Canada)
   42:  0.66%: .uk (United Kingdom)
  139:  0.51%: .de (Germany)
   61:  0.38%: .hu (Hungary)
  121:  0.36%: .ch (Switzerland)
   85:  0.32%: .it (Italy)
   21:  0.30%: .edu (USA Higher Education)
   50:  0.25%: .at (Austria)
   52:  0.20%: .dk (Denmark)
   29:  0.19%: .pl (Poland)
   16:  0.12%: .au (Australia)
   30:  0.12%: .org (Non Profit Making Organisations)
    8:  0.11%: .hk (Hong Kong)
   54:  0.11%: .pt (Portugal)
    7:  0.10%: .co (Colombia)
    9:  0.09%: .tw (Taiwan)
    6:  0.08%: .il (Israel)
   19:  0.07%: .do (Dominican Republic)
   20:  0.06%: .br (Brazil)
    4:  0.06%: .es (Spain)
    4:  0.06%: .us (United States)
   23:  0.06%: .fi (Finland)
   15:  0.05%: .ru (Russia)
    6:  0.04%: .ar (Argentina)
    7:  0.03%: .se (Sweden)
    6:  0.03%: .si (Slovenia)
    2:  0.03%: .kr (South Korea)
    2:  0.03%: .cz (Czech Republic)
    2:  0.03%: [unknown domain]
    1:  0.01%: [domain not given]
    1:  0.01%: .ee (Estonia)
    1:  0.01%: .cn (China)
    1:  0.01%: .tr (Turkey)
    1:  0.01%: .mx (Mexico)
    1:  0.01%: .sg (Singapore)
    1:  0.01%: .no (Norway)
    1:  0.01%: .lt (Lithuania)
    3:       : .arpa (Arpanet)
(Go To: Top: General Summary: Monthly Report: Daily Summary: Hourly Summary: Domain Report: Organisation Report: Operating System Report: Status Code Report: File Size Report: File Type Report: Directory Report)
This report lists the organisations of the computers which requested files.
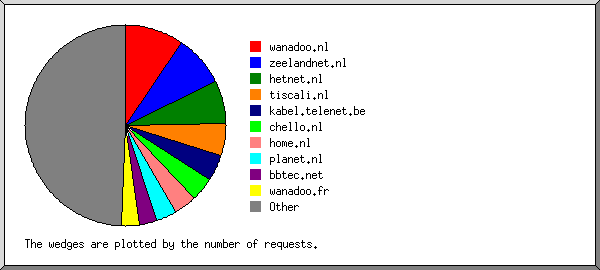
Listing the top 20 organisations by the number of requests, sorted by the number of requests.
reqs: %bytes: organisation
----: ------: ------------
1999:  5.73%: wanadoo.nl
1727:  7.42%: zeelandnet.nl
1406:  3.46%: hetnet.nl
1107:  2.63%: tiscali.nl
 848:  3.12%: kabel.telenet.be
 796:  3.32%: chello.nl
 761:  6.55%: home.nl
 680:  2.43%: planet.nl
 606:  1.86%: bbtec.net
 574:  1.72%: wanadoo.fr
 432:  4.53%: netfile.net
 428:  2.35%: xs4all.nl
 408:  1.10%: quicknet.nl
 406:  1.05%: a2000.nl
 362:  3.71%: googlebot.com
 352:  3.12%: wise-guys.nl
 314:  0.75%: zonnet.nl
 241:  0.84%: adsl.skynet.be
 240:  0.77%: aol.com
 233:  1.10%: mc.videotron.ca
6870: 42.43%: [not listed: 622 organisations]
(Go To: Top: General Summary: Monthly Report: Daily Summary: Hourly Summary: Domain Report: Organisation Report: Operating System Report: Status Code Report: File Size Report: File Type Report: Directory Report)
This report lists the operating systems used by visitors.
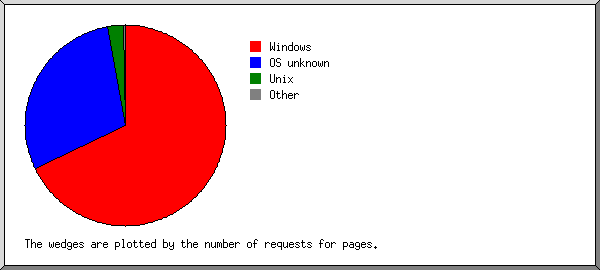
Listing operating systems, sorted by the number of requests for pages.
no.:  reqs: pages: OS
---: -----: -----: --
  1: 18193:  1209: Windows
   :  5118:   967:   Windows 98
   :  9493:   188:   Windows XP
   :  1335:    27:   Windows 2000
   :  2057:    15:   Windows ME
   :   128:     7:   Windows NT
   :    31:     3:   Windows 95
   :    27:     1:   Unknown Windows
   :     4:     1:   Windows CE
  2:  1801:   524: OS unknown
  3:   648:    47: Unix
   :   631:    47:   Linux
   :    17:     0:   FreeBSD
  4:   131:     4: Macintosh
(Go To: Top: General Summary: Monthly Report: Daily Summary: Hourly Summary: Domain Report: Organisation Report: Operating System Report: Status Code Report: File Size Report: File Type Report: Directory Report)
This report lists the HTTP status codes of all requests.
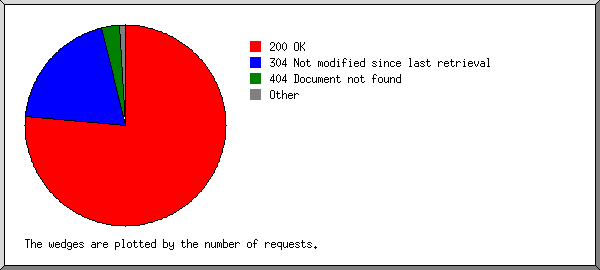
Listing status codes, sorted numerically.
 reqs: status code
-----: -----------
16494: 200 OK
   15: 206 Partial content
  106: 301 Document moved permanently
   45: 302 Document found elsewhere
 4281: 304 Not modified since last retrieval
    4: 400 Bad request
  634: 404 Document not found
    6: 408 Request timeout
    2: 501 Request type not supported
(Go To: Top: General Summary: Monthly Report: Daily Summary: Hourly Summary: Domain Report: Organisation Report: Operating System Report: Status Code Report: File Size Report: File Type Report: Directory Report)
This report lists the sizes of files.
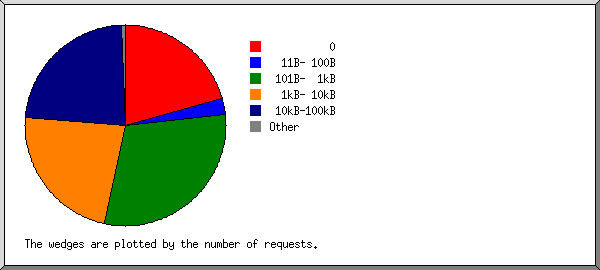
       size: reqs: %bytes:
-----------: ----: ------:
          0: 4304:       :
   1B-  10B:    0:       :
  11B- 100B:  537:  0.03%:
 101B-  1kB: 6246:  1.42%:
  1kB- 10kB: 4765: 17.36%:
 10kB-100kB: 4808: 67.15%:
100kB-  1MB:  130: 14.05%:
(Go To: Top: General Summary: Monthly Report: Daily Summary: Hourly Summary: Domain Report: Organisation Report: Operating System Report: Status Code Report: File Size Report: File Type Report: Directory Report)
This report lists the extensions of files.
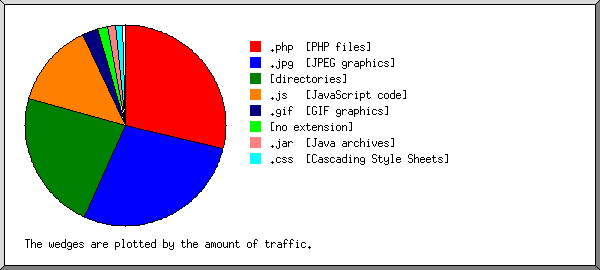
Listing extensions with at least 0.1% of the traffic, sorted by the amount of traffic.
 reqs: %bytes: extension
-----: ------: ---------
 3955: 28.83%: .php  [PHP files]
 1832: 27.88%: .jpg  [JPEG graphics]
 1791: 22.50%: [directories]
 1705: 13.83%: .js   [JavaScript code]
10618:  2.55%: .gif  [GIF graphics]
  154:  1.54%: [no extension]
    3:  1.29%: .jar  [Java archives]
  640:  1.15%: .css  [Cascading Style Sheets]
    1:  0.29%: .cab  [Cabinet files]
   91:  0.13%: [not listed: 6 extensions]
(Go To: Top: General Summary: Monthly Report: Daily Summary: Hourly Summary: Domain Report: Organisation Report: Operating System Report: Status Code Report: File Size Report: File Type Report: Directory Report)
This report lists the directories from which files were requested. (The figures for each directory include all of its subdirectories.)
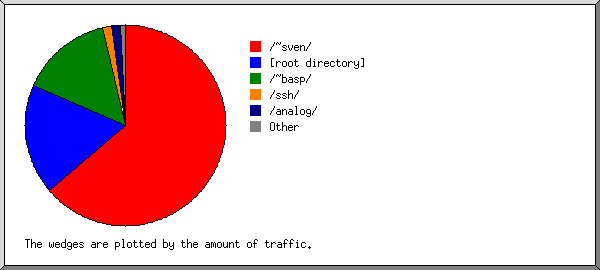
Listing directories with at least 0.01% of the traffic, sorted by the amount of traffic.
 reqs: %bytes: directory
-----: ------: ---------
17176: 63.71%: /~sven/
 1409: 17.74%: [root directory]
 1917: 14.86%: /~basp/
    4:  1.58%: /ssh/
   68:  1.41%: /analog/
  121:  0.35%: /images/
   55:  0.14%: /themes/
    6:  0.09%: [no directory]
   18:  0.06%: http://
   10:  0.04%: /cgi-bin/
    1:  0.01%: /x04/
    1:  0.01%: /x05/
    4:       : [not listed: 1 directory]
(Go To: Top: General Summary: Monthly Report: Daily Summary: Hourly Summary: Domain Report: Organisation Report: Operating System Report: Status Code Report: File Size Report: File Type Report: Directory Report)

