 Web Server Statistics for freegw.xs4all.nl
 Web Server Statistics for freegw.xs4all.nl
(Go To: Top: General Summary: Monthly Report: Daily Summary: Hourly Summary: Domain Report: Organisation Report: Operating System Report: Status Code Report: File Size Report: File Type Report: Directory Report)
This report contains overall statistics.
(Figures in parentheses refer to the 7-day period ending
01-Apr-2004 03:27).
Successful requests: 114,266 (5,384)
Average successful requests per day: 982 (769)
Successful requests for pages: 6,069 (615)
Average successful requests for pages per day: 52 (87)
Failed requests: 2,572 (114)
Redirected requests: 1,545 (61)
Distinct files requested: 2,147 (620)
Distinct hosts served: 3,377 (454)
Corrupt logfile lines: 124
Unwanted logfile entries: 10,877
Data transferred: 639.54 megabytes (37.11 megabytes)
Average data transferred per day: 5.50 megabytes (5.30 megabytes)
(Go To: Top: General Summary: Monthly Report: Daily Summary: Hourly Summary: Domain Report: Organisation Report: Operating System Report: Status Code Report: File Size Report: File Type Report: Directory Report)
This report lists the activity in each month.
Each unit ( ) represents 50 requests
for pages or part thereof.
month: reqs: pages: --------: -----: -----: Dec 2003: 43362: 1193:Busiest month: Mar 2004 (2,009 requests for pages).Jan 2004: 30483: 1674:
Feb 2004: 21194: 1186:
Mar 2004: 19168: 2009:
Apr 2004: 59: 7:

(Go To: Top: General Summary: Monthly Report: Daily Summary: Hourly Summary: Domain Report: Organisation Report: Operating System Report: Status Code Report: File Size Report: File Type Report: Directory Report)
This report lists the total activity for each day of the week, summed over all the weeks in the report.
Each unit ( ) represents 25 requests
for pages or part thereof.
day: reqs: pages: ---: -----: -----: Sun: 19585: 827:Mon: 15129: 852:
Tue: 17462: 838:
Wed: 17159: 1022:
Thu: 18964: 899:
Fri: 14332: 924:
Sat: 11635: 707:

(Go To: Top: General Summary: Monthly Report: Daily Summary: Hourly Summary: Domain Report: Organisation Report: Operating System Report: Status Code Report: File Size Report: File Type Report: Directory Report)
This report lists the total activity for each hour of the day, summed over all the days in the report.
Each unit ( ) represents 10 requests
for pages or part thereof.
hour: reqs: pages: ----: ----: -----: 0: 5047: 202:1: 4197: 227:
2: 2174: 133:
3: 1112: 172:
4: 925: 146:
5: 1377: 136:
6: 645: 143:
7: 812: 131:
8: 1534: 153:
9: 2586: 207:
10: 3595: 253:
11: 6185: 241:
12: 6740: 286:
13: 7037: 298:
14: 7170: 310:
15: 7332: 344:
16: 7222: 404:
17: 7327: 351:
18: 6751: 372:
19: 6215: 374:
20: 6010: 337:
21: 6267: 277:
22: 9176: 249:
23: 6830: 323:

(Go To: Top: General Summary: Monthly Report: Daily Summary: Hourly Summary: Domain Report: Organisation Report: Operating System Report: Status Code Report: File Size Report: File Type Report: Directory Report)
This report lists the countries of the computers which requested files.
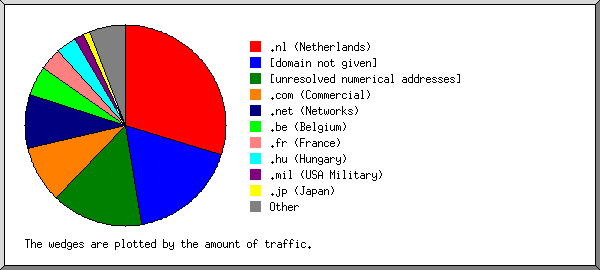
Listing domains, sorted by the amount of traffic.
 reqs: %bytes: domain
-----: ------: ------
33836: 29.80%: .nl (Netherlands)
35993: 17.60%: [domain not given]
11678: 14.71%: [unresolved numerical addresses]
 5532:  9.14%: .com (Commercial)
 8176:  8.61%: .net (Networks)
 5890:  4.81%: .be (Belgium)
 4472:  3.62%: .fr (France)
  941:  3.34%: .hu (Hungary)
   65:  1.50%: .mil (USA Military)
  952:  1.08%: .jp (Japan)
  698:  0.70%: .ch (Switzerland)
  706:  0.60%: .pt (Portugal)
  408:  0.59%: .hr (Croatia)
  832:  0.53%: .de (Germany)
  569:  0.46%: .it (Italy)
 1345:  0.43%: .dk (Denmark)
  388:  0.37%: .ca (Canada)
  159:  0.29%: .pl (Poland)
  236:  0.27%: .se (Sweden)
  146:  0.22%: .edu (USA Higher Education)
  109:  0.16%: .org (Non Profit Making Organisations)
  182:  0.14%: .br (Brazil)
  156:  0.12%: .uk (United Kingdom)
   98:  0.11%: .es (Spain)
   50:  0.11%: .sg (Singapore)
   97:  0.07%: .au (Australia)
   53:  0.06%: .lu (Luxembourg)
   48:  0.05%: .nz (New Zealand)
   17:  0.05%: .hk (Hong Kong)
  120:  0.05%: .ro (Romania)
   18:  0.04%: .il (Israel)
   16:  0.04%: .tw (Taiwan)
   39:  0.04%: .info (Informational)
   25:  0.04%: .at (Austria)
   29:  0.03%: .si (Slovenia)
   10:  0.03%: .gov (USA Government)
   29:  0.02%: .no (Norway)
    8:  0.02%: .ar (Argentina)
   28:  0.02%: .ru (Russia)
   38:  0.02%: .mx (Mexico)
    9:  0.02%: .fi (Finland)
   18:  0.02%: .us (United States)
   16:  0.01%: .lv (Latvia)
    4:  0.01%: .kr (South Korea)
    5:  0.01%: .arpa (Arpanet)
    2:  0.01%: .co (Colombia)
    2:  0.01%: .cc (Cocos (Keeling) Islands)
   13:       : .ie (Ireland)
    1:       : .aero (Air Transport Industry)
    1:       : .ee (Estonia)
    1:       : .cl (Chile)
    1:       : .id (Indonesia)
    1:       : .ph (Philippines)
(Go To: Top: General Summary: Monthly Report: Daily Summary: Hourly Summary: Domain Report: Organisation Report: Operating System Report: Status Code Report: File Size Report: File Type Report: Directory Report)
This report lists the organisations of the computers which requested files.
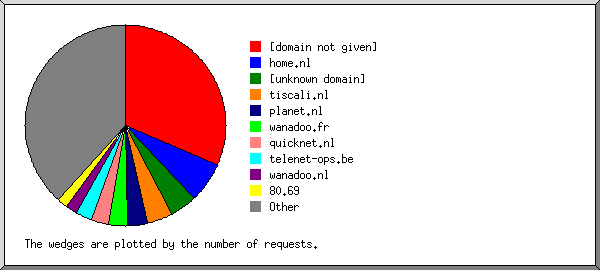
Listing the top 20 organisations by the number of requests, sorted by the number of requests.
 reqs: %bytes: organisation
-----: ------: ------------
35993: 17.60%: [domain not given]
 7318:  7.94%: home.nl
 5052:  5.73%: [unknown domain]
 4558:  1.47%: tiscali.nl
 3793:  2.97%: planet.nl
 3406:  2.40%: wanadoo.fr
 3130:  1.75%: quicknet.nl
 3023:  2.34%: telenet-ops.be
 2184:  2.13%: wanadoo.nl
 1964:  2.33%: 80.69
 1676:  1.75%: xs4all.nl
 1654:  1.76%: t-dialin.net
 1638:  2.08%: zonnet.nl
 1621:  1.03%: hetnet.nl
 1573:  1.72%: chello.nl
 1558:  1.23%: adsl.skynet.be
 1311:  0.66%: surf.net
 1259:  0.35%: tele.dk
 1133:  1.30%: proxad.net
 1099:  0.50%: a2000.nl
29323: 40.94%: [not listed: 1,018 organisations]
(Go To: Top: General Summary: Monthly Report: Daily Summary: Hourly Summary: Domain Report: Organisation Report: Operating System Report: Status Code Report: File Size Report: File Type Report: Directory Report)
This report lists the operating systems used by visitors.
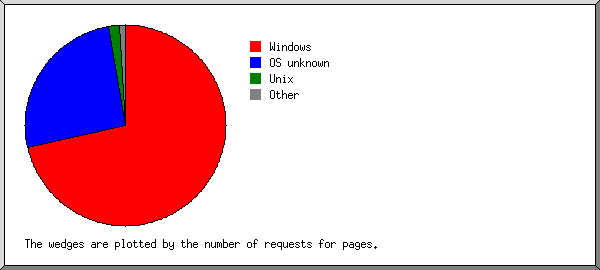
Listing operating systems, sorted by the number of requests for pages.
no.:   reqs: pages: OS
---: ------: -----: --
  1: 105071:  4298: Windows
   :  48329:  2705:   Windows 98
   :  41549:  1029:   Windows XP
   :  11219:   419:   Windows 2000
   :   2475:    69:   Windows ME
   :    423:    35:   Windows 95
   :    945:    35:   Windows NT
   :    131:     6:   Unknown Windows
  2:   6613:  1564: OS unknown
  3:   1146:   107: Unix
   :    683:    62:   Linux
   :    436:    42:   FreeBSD
   :     27:     3:   SunOS
  4:    962:    50: Macintosh
(Go To: Top: General Summary: Monthly Report: Daily Summary: Hourly Summary: Domain Report: Organisation Report: Operating System Report: Status Code Report: File Size Report: File Type Report: Directory Report)
This report lists the HTTP status codes of all requests.
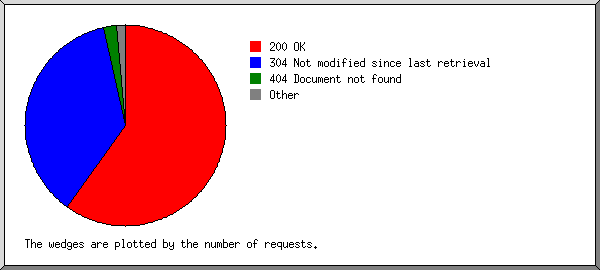
Listing status codes, sorted numerically.
 reqs: status code
-----: -----------
70842: 200 OK
   43: 206 Partial content
  540: 301 Document moved permanently
 1005: 302 Document found elsewhere
43381: 304 Not modified since last retrieval
   44: 400 Bad request
   17: 403 Access forbidden
 2487: 404 Document not found
   19: 408 Request timeout
    2: 500 Internal server error
    3: 501 Request type not supported
(Go To: Top: General Summary: Monthly Report: Daily Summary: Hourly Summary: Domain Report: Organisation Report: Operating System Report: Status Code Report: File Size Report: File Type Report: Directory Report)
This report lists the sizes of files.
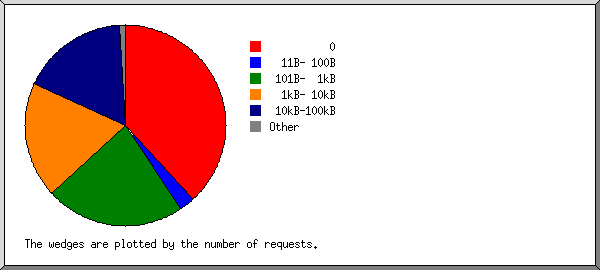
       size:  reqs: %bytes:
-----------: -----: ------:
          0: 43679:       :
   1B-  10B:     0:       :
  11B- 100B:  2735:  0.03%:
 101B-  1kB: 25607:  1.19%:
  1kB- 10kB: 21429: 18.16%:
 10kB-100kB: 19881: 56.12%:
100kB-  1MB:   923: 20.67%:
  1MB- 10MB:    12:  3.83%:
(Go To: Top: General Summary: Monthly Report: Daily Summary: Hourly Summary: Domain Report: Organisation Report: Operating System Report: Status Code Report: File Size Report: File Type Report: Directory Report)
This report lists the extensions of files.
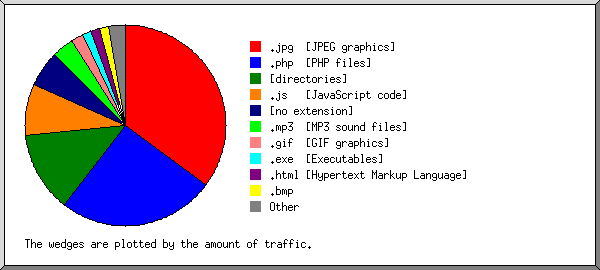
Listing extensions with at least 0.1% of the traffic, sorted by the amount of traffic.
 reqs: %bytes: extension
-----: ------: ---------
15525: 35.12%: .jpg  [JPEG graphics]
16280: 25.21%: .php  [PHP files]
 5533: 13.01%: [directories]
 8147:  8.36%: .js   [JavaScript code]
 2618:  5.83%: [no extension]
   22:  3.42%: .mp3  [MP3 sound files]
58854:  2.04%: .gif  [GIF graphics]
   57:  1.48%: .exe  [Executables]
  536:  1.46%: .html [Hypertext Markup Language]
  211:  1.45%: .bmp
 3188:  0.80%: .css  [Cascading Style Sheets]
    9:  0.47%: .cab  [Cabinet files]
 1819:  0.36%: .png  [PNG graphics]
    5:  0.36%: .jar  [Java archives]
    4:  0.10%: .EXE
   82:  0.10%: .pas  [Pascal source files]
 1376:  0.43%: [not listed: 30 extensions]
(Go To: Top: General Summary: Monthly Report: Daily Summary: Hourly Summary: Domain Report: Organisation Report: Operating System Report: Status Code Report: File Size Report: File Type Report: Directory Report)
This report lists the directories from which files were requested. (The figures for each directory include all of its subdirectories.)
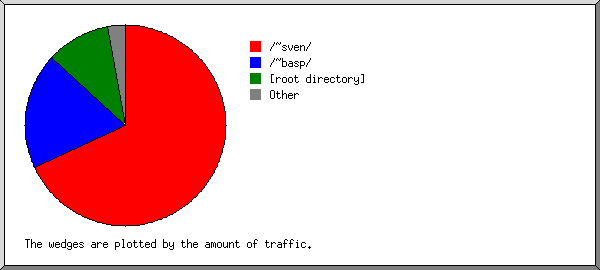
Listing directories with at least 0.01% of the traffic, sorted by the amount of traffic.
 reqs: %bytes: directory
-----: ------: ---------
95325: 68.08%: /~sven/
12483: 18.79%: /~basp/
 3900: 10.35%: [root directory]
   13:  0.83%: /ssh/
  438:  0.59%: /analog/
  724:  0.52%: /images/
  541:  0.48%: /cgi-bin/
  304:  0.12%: /themes/
   39:  0.11%: [no directory]
   39:  0.05%: /gallery/
    9:  0.03%: http://
   10:  0.03%: /webalizer/
  407:  0.02%: /icons/
   34:  0.01%: [not listed: 3 directories]
(Go To: Top: General Summary: Monthly Report: Daily Summary: Hourly Summary: Domain Report: Organisation Report: Operating System Report: Status Code Report: File Size Report: File Type Report: Directory Report)