 Web Server Statistics for freegw.xs4all.nl Web Server Statistics for freegw.xs4all.nl
(Go To: Top: General Summary: Monthly Report: Daily Summary: Hourly Summary: Domain Report: Organisation Report: Operating System Report: Status Code Report: File Size Report: File Type Report: Directory Report: Request Report)
This report contains overall statistics.
(Figures in parentheses refer to the 7-day period ending
01-Sep-2002 03:14).
Successful requests: 3,887 (2,176)
Average successful requests per day: 296 (310)
Successful requests for pages: 202 (151)
Average successful requests for pages per day: 15 (21)
Failed requests: 342 (58)
Redirected requests: 10 (9)
Distinct files requested: 260 (256)
Distinct hosts served: 66 (22)
Corrupt logfile lines: 17
Unwanted logfile entries: 24,396
Data transferred: 12.706 megabytes (6.129 megabytes)
Average data transferred per day: 992.274 kilobytes (896.680 kilobytes)
(Go To: Top: General Summary: Monthly Report: Daily Summary: Hourly Summary: Domain Report: Organisation Report: Operating System Report: Status Code Report: File Size Report: File Type Report: Directory Report: Request Report)
This report lists the activity in each month.
Each unit ( ) represents 5 requests
for pages or part thereof.
) represents 5 requests
for pages or part thereof.
   month: reqs: pages:
--------: ----: -----:
Aug 2002: 3887:   202:
Busiest month: Aug 2002 (202 requests for pages).
(Go To: Top: General Summary: Monthly Report: Daily Summary: Hourly Summary: Domain Report: Organisation Report: Operating System Report: Status Code Report: File Size Report: File Type Report: Directory Report: Request Report)
This report lists the total activity for each day of the week, summed over all the weeks in the report.
Each unit () represents 1 request
for a page.
day: reqs: pages: ---: ----: -----: Sun: 527: 45:Tue: 1359: 45:
Sat: 555: 38:
(Go To: Top: General Summary: Monthly Report: Daily Summary: Hourly Summary: Domain Report: Organisation Report: Operating System Report: Status Code Report: File Size Report: File Type Report: Directory Report: Request Report)
This report lists the total activity for each hour of the day, summed over all the days in the report.
Each unit () represents 1 request
for a page.
hour: reqs: pages: ----: ----: -----: 0: 263: 14:
(Go To: Top: General Summary: Monthly Report: Daily Summary: Hourly Summary: Domain Report: Organisation Report: Operating System Report: Status Code Report: File Size Report: File Type Report: Directory Report: Request Report)
This report lists the countries of the computers which requested files.
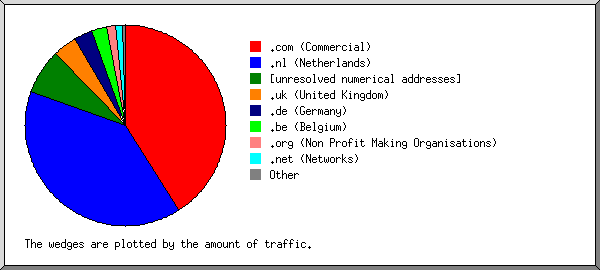
Listing domains, sorted by the amount of traffic.
reqs: %bytes: domain
----: ------: ------
1612: 41.00%: .com (Commercial)
1717: 39.43%: .nl (Netherlands)
 293:  7.36%: [unresolved numerical addresses]
  84:  3.76%: .uk (United Kingdom)
  50:  2.97%: .de (Germany)
  80:  2.59%: .be (Belgium)
  14:  1.34%: .org (Non Profit Making Organisations)
  31:  1.16%: .net (Networks)
   4:  0.33%: .it (Italy)
   2:  0.05%: .fr (France)
(Go To: Top: General Summary: Monthly Report: Daily Summary: Hourly Summary: Domain Report: Organisation Report: Operating System Report: Status Code Report: File Size Report: File Type Report: Directory Report: Request Report)
This report lists the organisations of the computers which requested files.
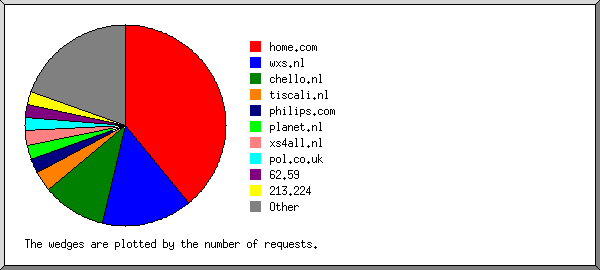
Listing the top 20 organisations by the number of requests, sorted by the number of requests.
reqs: %bytes: organisation
----: ------: ------------
1520: 37.32%: home.com
 562:  8.06%: wxs.nl
 396:  8.07%: chello.nl
 131:  4.88%: tiscali.nl
  91:  3.56%: philips.com
  90:  3.61%: planet.nl
  90:  3.29%: xs4all.nl
  84:  3.76%: pol.co.uk
  80:  1.81%: 62.59
  80:  2.89%: 213.224
  70:  2.11%: kabelfoon.nl
  54:  2.26%: a2000.nl
  50:  2.97%: sick.de
  49:  1.56%: adsl.skynet.be
  48:  1.51%: isd-holland.nl
  46:  0.48%: zeelandnet.nl
  42:  1.43%: demon.nl
  35:  0.45%: freeaccess.nl
  35:  1.02%: 81.80
  34:  1.02%: 212.171
 300:  7.94%: [not listed: 22 organisations]
(Go To: Top: General Summary: Monthly Report: Daily Summary: Hourly Summary: Domain Report: Organisation Report: Operating System Report: Status Code Report: File Size Report: File Type Report: Directory Report: Request Report)
This report lists the operating systems used by visitors.
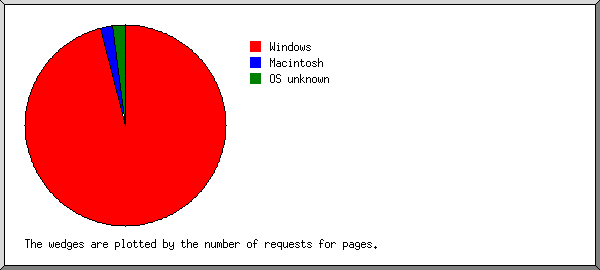
Listing operating systems, sorted by the number of requests for pages.
no.: reqs: pages: OS
---: ----: -----: --
  1: 3728:   194: Windows
   : 2666:   159:   Windows 98
   :  632:    16:   Windows XP
   :  137:     6:   Windows ME
   :  140:     5:   Windows NT
   :    4:     4:   Windows 95
   :  146:     4:   Windows 2000
   :    3:     0:   Windows 32-bit
  2:  133:     4: Macintosh
   :  133:     4:   Macintosh PowerPC
  3:   22:     4: OS unknown
(Go To: Top: General Summary: Monthly Report: Daily Summary: Hourly Summary: Domain Report: Organisation Report: Operating System Report: Status Code Report: File Size Report: File Type Report: Directory Report: Request Report)
This report lists the HTTP status codes of all requests.
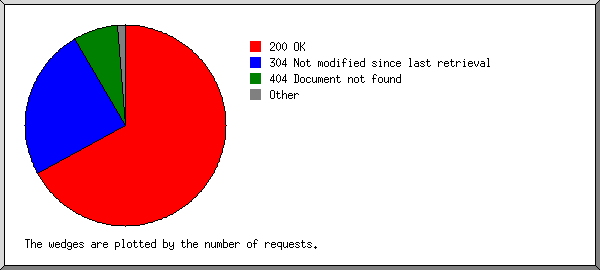
Listing status codes, sorted numerically.
reqs: status code
----: -----------
2840: 200 OK
   2: 206 Partial content
  10: 301 Document moved permanently
1045: 304 Not modified since last retrieval
  37: 400 Bad request
 305: 404 Document not found
(Go To: Top: General Summary: Monthly Report: Daily Summary: Hourly Summary: Domain Report: Organisation Report: Operating System Report: Status Code Report: File Size Report: File Type Report: Directory Report: Request Report)
This report lists the sizes of files.
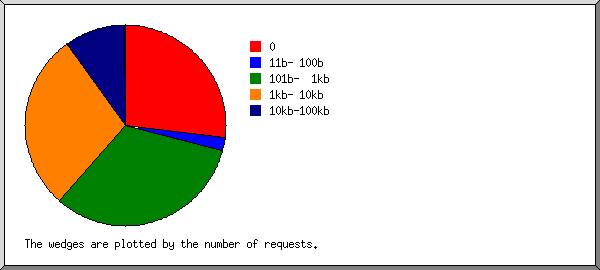
       size: reqs: %bytes:
-----------: ----: ------:
          0: 1052:       :
   1b-  10b:    0:       :
  11b- 100b:   79:  0.05%:
 101b-  1kb: 1252:  2.64%:
  1kb- 10kb: 1117: 34.36%:
 10kb-100kb:  382: 52.24%:
100kb-  1Mb:    5: 10.70%:
(Go To: Top: General Summary: Monthly Report: Daily Summary: Hourly Summary: Domain Report: Organisation Report: Operating System Report: Status Code Report: File Size Report: File Type Report: Directory Report: Request Report)
This report lists the extensions of requested files.
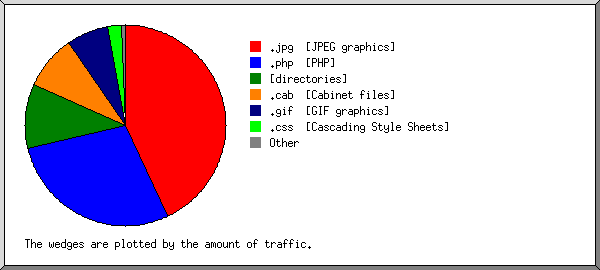
Listing extensions with at least 0.1% of the traffic, sorted by the amount of traffic.
reqs: %bytes: extension
----: ------: ---------
 808: 43.10%: .jpg  [JPEG graphics]
 461: 28.17%: .php  [PHP]
 202: 10.34%: [directories]
   3:  8.88%: .cab  [Cabinet files]
2206:  6.77%: .gif  [GIF graphics]
 194:  2.18%: .css  [Cascading Style Sheets]
   3:  0.20%: .140:21
   8:  0.20%: .png  [PNG graphics]
   1:  0.12%: [no extension]
   1:  0.05%: [not listed: 1 extension]
(Go To: Top: General Summary: Monthly Report: Daily Summary: Hourly Summary: Domain Report: Organisation Report: Operating System Report: Status Code Report: File Size Report: File Type Report: Directory Report: Request Report)
This report lists the directories from which files were requested. (The figures for each directory include all of its subdirectories.)
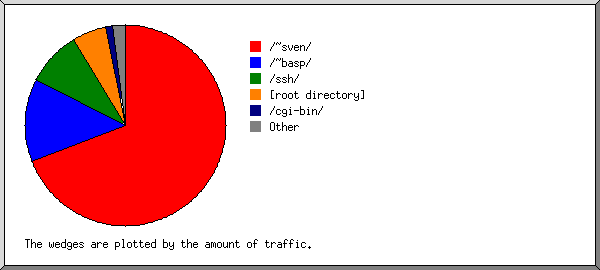
Listing directories with at least 0.01% of the traffic, sorted by the amount of traffic.
reqs: %bytes: directory
----: ------: ---------
2657: 69.06%: /~sven/
 785: 13.45%: /~basp/
   3:  8.88%: /ssh/
  57:  5.54%: [root directory]
  26:  1.13%: /cgi-bin/
 223:  0.69%: /images/
  17:  0.36%: /analog/
   4:  0.32%: [no directory]
   5:  0.32%: http://
  35:  0.19%: /themes/
  75:  0.07%: /icons/
(Go To: Top: General Summary: Monthly Report: Daily Summary: Hourly Summary: Domain Report: Organisation Report: Operating System Report: Status Code Report: File Size Report: File Type Report: Directory Report: Request Report)
This report lists the files on the site.
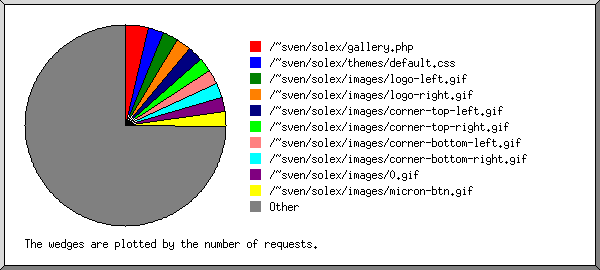
Listing files with at least 20 requests, sorted by the number of requests.
reqs: %bytes:       last time: file
----: ------: ---------------: ----
 147:  7.59%: 30/Aug/02 19:47: /~sven/solex/gallery.php
  14:  0.62%: 30/Aug/02 19:47:   /~sven/solex/gallery.php?photo=micron-4
  12:  0.55%: 29/Aug/02 21:28:   /~sven/solex/gallery.php?photo=5000-4
  11:  0.51%: 29/Aug/02 21:27:   /~sven/solex/gallery.php?photo=plisolex-motor
  11:  0.52%: 29/Aug/02 21:27:   /~sven/solex/gallery.php?photo=plisolex
  10:  0.46%: 29/Aug/02 21:27:   /~sven/solex/gallery.php?photo=5000-2
  10:  0.47%: 29/Aug/02 21:28:   /~sven/solex/gallery.php?photo=5000-3
  97:  1.86%: 30/Aug/02 20:34: /~sven/solex/themes/default.css
  95:  1.59%: 30/Aug/02 20:34: /~sven/solex/images/logo-left.gif
  94:  0.29%: 30/Aug/02 20:34: /~sven/solex/images/logo-right.gif
  93:  0.06%: 30/Aug/02 20:34: /~sven/solex/images/corner-top-left.gif
  92:  0.06%: 30/Aug/02 20:34: /~sven/solex/images/corner-top-right.gif
  91:  0.06%: 30/Aug/02 20:34: /~sven/solex/images/corner-bottom-left.gif
  90:  0.06%: 30/Aug/02 20:34: /~sven/solex/images/corner-bottom-right.gif
  90:  0.06%: 30/Aug/02 20:34: /~sven/solex/images/0.gif
  89:  0.15%: 30/Aug/02 20:34: /~sven/solex/images/micron-btn.gif
  89:  0.15%: 30/Aug/02 20:34: /~sven/solex/images/5000-btn.gif
  89:  0.14%: 30/Aug/02 20:34: /~sven/solex/images/photos-btn.gif
  89:  0.75%: 30/Aug/02 20:34: /~sven/solex/images/solex.gif
  89:  0.13%: 30/Aug/02 20:34: /~sven/solex/images/intro-btn.gif
  89:  0.13%: 30/Aug/02 20:34: /~sven/solex/images/links-btn.gif
  75:  3.82%: 30/Aug/02 20:34: /~sven/solex/
  61:  0.18%: 30/Aug/02 20:34: /~sven/solex/images/intro.gif
  46:  2.90%: 25/Aug/02 21:21: /~basp/index.php
  41:  0.11%: 30/Aug/02 20:34: /~sven/solex/images/5000.gif
  39:  1.16%: 25/Aug/02 21:19: /~basp/comments.php
  38:  0.93%: 30/Aug/02 19:46: /~sven/solex/pictures/5000-2-detail.jpg
  38:  0.51%: 30/Aug/02 19:46: /~sven/solex/pictures/5000-1-detail.jpg
  38:  0.14%: 30/Aug/02 19:46: /~sven/solex/images/photos.gif
  37:  0.66%: 30/Aug/02 19:46: /~sven/solex/pictures/plisolex-motor-detail.jpg
  37:  0.54%: 30/Aug/02 19:46: /~sven/solex/pictures/micron-3-detail.jpg
  37:  0.63%: 30/Aug/02 19:46: /~sven/solex/pictures/5000-4-detail.jpg
  37:  0.60%: 30/Aug/02 19:46: /~sven/solex/pictures/5000-3-detail.jpg
  37:  0.59%: 30/Aug/02 19:46: /~sven/solex/pictures/plisolex-detail.jpg
  37:  0.67%: 30/Aug/02 19:46: /~sven/solex/pictures/micron-4-detail.jpg
  35:  0.19%: 31/Aug/02 13:33: /themes/default.css
  35:  0.02%: 31/Aug/02 13:33: /images/status.gif
  35:  0.02%: 31/Aug/02 13:33: /images/login.gif
  35:  0.01%: 31/Aug/02 13:33: /images/ls.gif
  34:  4.00%: 30/Aug/02 20:34: /~sven/solex/5000.php
  34:  0.12%: 31/Aug/02 13:25: /~basp/phpblog/gfx/phpblog.jpg
  34:  0.18%: 31/Aug/02 13:25: /~basp/eurex/gfx/eurex_logo_off.gif
  33:  1.27%: 28/Aug/02 00:51: /~basp/eurex/static.php
  10:  0.38%: 28/Aug/02 00:51:   /~basp/eurex/static.php?page=services.sp
  33:  0.70%: 31/Aug/02 13:25: /~basp/
  32:  2.66%: 31/Aug/02 13:33: /index.php
  11:  0.95%: 27/Aug/02 15:18:   /index.php?page=ssh
  32:  0.02%: 30/Aug/02 19:45: /~sven/solex/images/3.gif
  32:  1.54%: 30/Aug/02 14:59: /~basp/phpblog/index.php
  29:  0.12%: 30/Aug/02 19:46: /~sven/solex/images/micron.gif
  29:  2.57%: 30/Aug/02 20:34: /~sven/solex/pictures/5000-frans.jpg
  29:  0.24%: 30/Aug/02 20:34: /~sven/solex/images/specs-5000.gif
  29:  4.45%: 30/Aug/02 20:34: /~sven/solex/pictures/5000-advertentie-small.jpg
  29:  7.58%: 30/Aug/02 20:34: /~sven/solex/pictures/5000-xplv-small.jpg
  28:  0.02%: 29/Aug/02 11:57: /~sven/solex/images/2.gif
  27:  3.22%: 28/Aug/02 20:03: /~sven/solex/micron.php
  26:  2.34%: 30/Aug/02 20:12: /~sven/solex/links.php
  26:  0.02%: 30/Aug/02 20:34: /~sven/solex/images/6.gif
  25:  2.87%: 31/Aug/02 13:33: /
  25:  0.02%: 30/Aug/02 20:34: /~sven/solex/images/5.gif
  25:  0.12%: 31/Aug/02 13:33: /images/freebsd.jpg
  25:  0.14%: 31/Aug/02 13:25: /~basp/theshed/images/TheShed.jpg
  24:  2.10%: 28/Aug/02 20:03: /~sven/solex/pictures/micron-1.jpg
  24:  0.05%: 31/Aug/02 13:38: /icons/apache_pb.gif
  24:  1.74%: 28/Aug/02 20:03: /~sven/solex/pictures/micron-2.jpg
  23:  0.23%: 28/Aug/02 20:03: /~sven/solex/images/specs-micron.gif
  23:  0.01%: 31/Aug/02 13:33: /images/motd.gif
  23:  0.02%: 30/Aug/02 20:34: /~sven/solex/images/4.gif
  21:  0.07%: 30/Aug/02 20:12: /~sven/solex/images/links.gif
  21:  0.01%: 30/Aug/02 20:12: /~sven/solex/images/flag-nl.gif
  21:  0.01%: 30/Aug/02 20:12: /~sven/solex/images/flag-f.gif
  21:  0.08%: 30/Aug/02 20:12: /~sven/solex/images/flag-gb.gif
  21:  0.03%: 31/Aug/02 12:25: /~basp/eurex/gfx/services_on.jpg
  21:  0.01%: 30/Aug/02 20:12: /~sven/solex/images/flag-d.gif
  20:  0.01%: 31/Aug/02 13:38: /icons/cvsweb/dir.gif
  20:       : 31/Aug/02 13:38: /icons/cvsweb/back.gif
 803: 34.67%: 31/Aug/02 23:54: [not listed: 132 files]
(Go To: Top: General Summary: Monthly Report: Daily Summary: Hourly Summary: Domain Report: Organisation Report: Operating System Report: Status Code Report: File Size Report: File Type Report: Directory Report: Request Report)


