 Web Server Statistics for freegw.xs4all.nl
 Web Server Statistics for freegw.xs4all.nl
(Go To: Top: General Summary: Monthly Report: Daily Summary: Hourly Summary: Domain Report: Organisation Report: Operating System Report: Status Code Report: File Size Report: File Type Report: Directory Report)
This report contains overall statistics.
(Figures in parentheses refer to the 7-day period ending
01-Nov-2004 03:04).
Successful requests: 55,036 (6,225)
Average successful requests per day: 946 (889)
Successful requests for pages: 3,623 (537)
Average successful requests for pages per day: 62 (76)
Failed requests: 3,373 (221)
Redirected requests: 1,224 (123)
Distinct files requested: 2,002 (775)
Distinct hosts served: 1,374 (363)
Corrupt logfile lines: 65
Unwanted logfile entries: 89,599
Data transferred: 378.55 megabytes (52.61 megabytes)
Average data transferred per day: 6.51 megabytes (7.52 megabytes)
(Go To: Top: General Summary: Monthly Report: Daily Summary: Hourly Summary: Domain Report: Organisation Report: Operating System Report: Status Code Report: File Size Report: File Type Report: Directory Report)
This report lists the activity in each month.
Each unit ( ) represents 60 requests
for pages or part thereof.
month: reqs: pages: --------: -----: -----: Sep 2004: 31231: 2201:Busiest month: Sep 2004 (2,201 requests for pages).Oct 2004: 23771: 1407:
Nov 2004: 34: 15:

(Go To: Top: General Summary: Monthly Report: Daily Summary: Hourly Summary: Domain Report: Organisation Report: Operating System Report: Status Code Report: File Size Report: File Type Report: Directory Report)
This report lists the total activity for each day of the week, summed over all the weeks in the report.
Each unit ( ) represents 15 requests
for pages or part thereof.
day: reqs: pages: ---: ----: -----: Sun: 8174: 600:Mon: 8538: 564:
Tue: 8348: 503:
Wed: 8675: 388:
Thu: 5314: 522:
Fri: 6729: 475:
Sat: 9258: 571:

(Go To: Top: General Summary: Monthly Report: Daily Summary: Hourly Summary: Domain Report: Organisation Report: Operating System Report: Status Code Report: File Size Report: File Type Report: Directory Report)
This report lists the total activity for each hour of the day, summed over all the days in the report.
Each unit ( ) represents 8 requests
for pages or part thereof.
hour: reqs: pages: ----: ----: -----: 0: 1350: 158:1: 754: 92:
2: 717: 106:
3: 1248: 128:
4: 665: 119:
5: 615: 70:
6: 540: 78:
7: 861: 59:
8: 1696: 169:
9: 1343: 113:
10: 1612: 115:
11: 2694: 123:
12: 2426: 122:
13: 2125: 119:
14: 3594: 150:
15: 3535: 163:
16: 3518: 257:
17: 3062: 194:
18: 3609: 171:
19: 3746: 259:
20: 3834: 285:
21: 4201: 123:
22: 4101: 180:
23: 3190: 270:

(Go To: Top: General Summary: Monthly Report: Daily Summary: Hourly Summary: Domain Report: Organisation Report: Operating System Report: Status Code Report: File Size Report: File Type Report: Directory Report)
This report lists the countries of the computers which requested files.
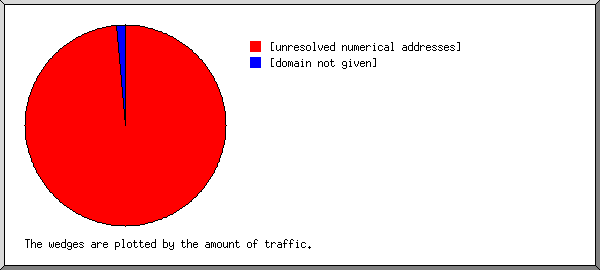
Listing domains, sorted by the amount of traffic.
 reqs: %bytes: domain
-----: ------: ------
54121: 98.71%: [unresolved numerical addresses]
  915:  1.29%: [domain not given]
(Go To: Top: General Summary: Monthly Report: Daily Summary: Hourly Summary: Domain Report: Organisation Report: Operating System Report: Status Code Report: File Size Report: File Type Report: Directory Report)
This report lists the organisations of the computers which requested files.
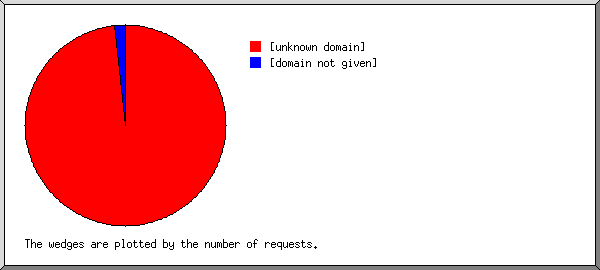
Listing organisations, sorted by the number of requests.
 reqs: %bytes: organisation
-----: ------: ------------
54121: 98.71%: [unknown domain]
  915:  1.29%: [domain not given]
(Go To: Top: General Summary: Monthly Report: Daily Summary: Hourly Summary: Domain Report: Organisation Report: Operating System Report: Status Code Report: File Size Report: File Type Report: Directory Report)
This report lists the operating systems used by visitors.
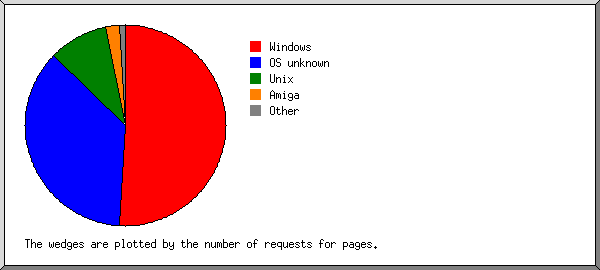
Listing operating systems, sorted by the number of requests for pages.
no.:  reqs: pages: OS
---: -----: -----: --
  1: 43901:  1824: Windows
   : 29571:  1121:   Windows XP
   :  6749:   553:   Windows 2000
   :  5859:   106:   Windows 98
   :  1386:    28:   Windows ME
   :    84:     9:   Unknown Windows
   :   132:     6:   Windows NT
   :   120:     1:   Windows 95
  2:  9695:  1309: OS unknown
  3:   896:   342: Unix
   :   827:   297:   Linux
   :    67:    43:   FreeBSD
   :     2:     2:   Other Unix
  4:    83:    83: Amiga
  5:   369:    27: Macintosh
  6:     4:     4: Atari
(Go To: Top: General Summary: Monthly Report: Daily Summary: Hourly Summary: Domain Report: Organisation Report: Operating System Report: Status Code Report: File Size Report: File Type Report: Directory Report)
This report lists the HTTP status codes of all requests.
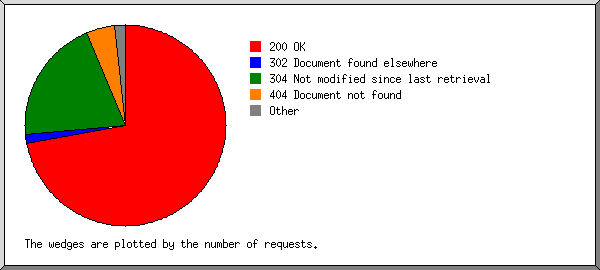
Listing status codes, sorted numerically.
 reqs: status code
-----: -----------
42944: 200 OK
   24: 206 Partial content
  367: 301 Document moved permanently
  857: 302 Document found elsewhere
12068: 304 Not modified since last retrieval
   13: 400 Bad request
   90: 401 Authentication required
  457: 403 Access forbidden
 2794: 404 Document not found
    1: 405 Method not allowed
    3: 408 Request timeout
   15: 500 Internal server error
(Go To: Top: General Summary: Monthly Report: Daily Summary: Hourly Summary: Domain Report: Organisation Report: Operating System Report: Status Code Report: File Size Report: File Type Report: Directory Report)
This report lists the sizes of files.
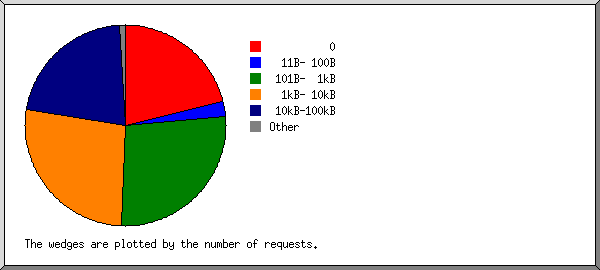
       size:  reqs: %bytes:
-----------: -----: ------:
          0: 11720:       :
   1B-  10B:     4:       :
  11B- 100B:  1314:  0.03%:
 101B-  1kB: 14818:  1.14%:
  1kB- 10kB: 14759: 17.35%:
 10kB-100kB: 11962: 63.94%:
100kB-  1MB:   458: 17.15%:
  1MB- 10MB:     1:  0.40%:
(Go To: Top: General Summary: Monthly Report: Daily Summary: Hourly Summary: Domain Report: Organisation Report: Operating System Report: Status Code Report: File Size Report: File Type Report: Directory Report)
This report lists the extensions of files.
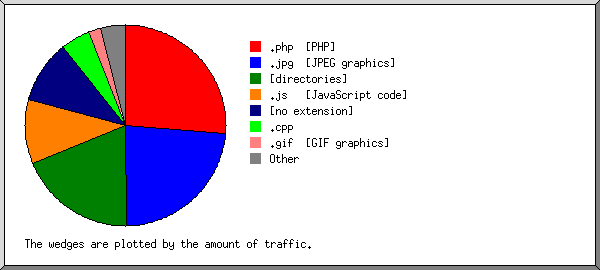
Listing extensions with at least 0.1% of the traffic, sorted by the amount of traffic.
 reqs: %bytes: extension
-----: ------: ---------
11906: 26.30%: .php  [PHP]
 4726: 23.54%: .jpg  [JPEG graphics]
 3618: 18.90%: [directories]
 3489: 10.33%: .js   [JavaScript code]
 2308: 10.25%: [no extension]
  548:  4.72%: .cpp
24796:  2.06%: .gif  [GIF graphics]
 2541:  0.99%: .css  [Cascading Style Sheets]
   11:  0.71%: .jar  [Compressed file archives]
   61:  0.61%: .diff
    5:  0.50%: .cab  [Cabinet files/ Install Shield Compressed file archives]
  188:  0.47%: .h
  712:  0.30%: .png  [PNG graphics]
  127:  0.33%: [not listed: 21 extensions]
(Go To: Top: General Summary: Monthly Report: Daily Summary: Hourly Summary: Domain Report: Organisation Report: Operating System Report: Status Code Report: File Size Report: File Type Report: Directory Report)
This report lists the directories from which files were requested. (The figures for each directory include all of its subdirectories.)
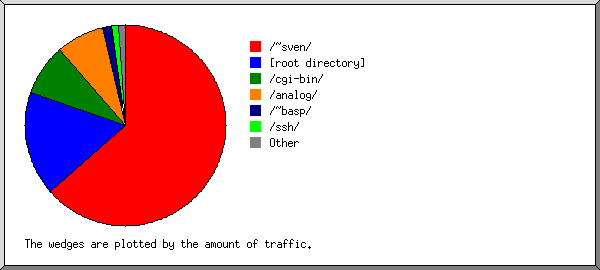
Listing directories with at least 0.01% of the traffic, sorted by the amount of traffic.
 reqs: %bytes: directory
-----: ------: ---------
40463: 63.38%: /~sven/
 4222: 16.81%: [root directory]
 1653:  8.35%: /cgi-bin/
 1414:  7.92%: /analog/
 2079:  1.38%: /~basp/
   11:  1.10%: /ssh/
 1366:  0.63%: /images/
  586:  0.18%: /themes/
   25:  0.14%: [no directory]
  702:  0.05%: /css/
 2508:  0.04%: /icons/
    4:  0.02%: http://
    3:  0.01%: [not listed: 1 directory]
(Go To: Top: General Summary: Monthly Report: Daily Summary: Hourly Summary: Domain Report: Organisation Report: Operating System Report: Status Code Report: File Size Report: File Type Report: Directory Report)