 Web Server Statistics for freegw.xs4all.nl Web Server Statistics for freegw.xs4all.nl
(Go To: Top: General Summary: Monthly Report: Daily Summary: Hourly Summary: Domain Report: Organisation Report: Operating System Report: Status Code Report: File Size Report: File Type Report: Directory Report)
This report contains overall statistics.
(Figures in parentheses refer to the 7-day period ending
01-Sep-2004 03:14).
Successful requests: 98,081 (7,858)
Average successful requests per day: 815 (1,122)
Successful requests for pages: 5,151 (695)
Average successful requests for pages per day: 42 (99)
Failed requests: 4,996 (677)
Redirected requests: 486 (56)
Distinct files requested: 2,123 (579)
Distinct hosts served: 3,026 (197)
Corrupt logfile lines: 892
Unwanted logfile entries: 74,447
Data transferred: 695.60 megabytes (48.00 megabytes)
Average data transferred per day: 5.78 megabytes (6.86 megabytes)
(Go To: Top: General Summary: Monthly Report: Daily Summary: Hourly Summary: Domain Report: Organisation Report: Operating System Report: Status Code Report: File Size Report: File Type Report: Directory Report)
This report lists the activity in each month.
Each unit ( ) represents 50 requests
for pages or part thereof.
) represents 50 requests
for pages or part thereof.
month: reqs: pages: --------: -----: -----: May 2004: 20653: 1786:Busiest month: May 2004 (1,786 requests for pages).Jun 2004: 30061: 1204:
(Go To: Top: General Summary: Monthly Report: Daily Summary: Hourly Summary: Domain Report: Organisation Report: Operating System Report: Status Code Report: File Size Report: File Type Report: Directory Report)
This report lists the total activity for each day of the week, summed over all the weeks in the report.
Each unit () represents 20 requests
for pages or part thereof.
day: reqs: pages: ---: -----: -----: Sun: 18153: 727:Thu: 11510: 637:
Fri: 11316: 800:
(Go To: Top: General Summary: Monthly Report: Daily Summary: Hourly Summary: Domain Report: Organisation Report: Operating System Report: Status Code Report: File Size Report: File Type Report: Directory Report)
This report lists the total activity for each hour of the day, summed over all the days in the report.
Each unit () represents 8 requests
for pages or part thereof.
hour: reqs: pages: ----: ----: -----: 0: 2989: 187:3: 1084: 166:
(Go To: Top: General Summary: Monthly Report: Daily Summary: Hourly Summary: Domain Report: Organisation Report: Operating System Report: Status Code Report: File Size Report: File Type Report: Directory Report)
This report lists the countries of the computers which requested files.
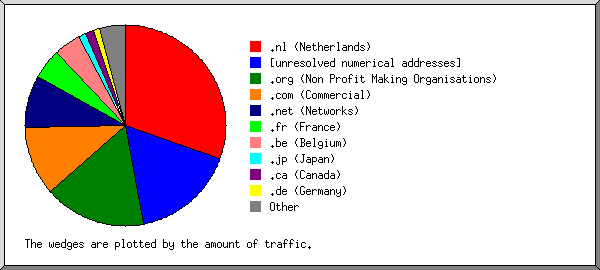
Listing domains, sorted by the amount of traffic.
 reqs: %bytes: domain
-----: ------: ------
42920: 30.46%: .nl (Netherlands)
12843: 16.52%: [unresolved numerical addresses]
 1186: 16.48%: .org (Non Profit Making Organisations)
 7744: 11.09%: .com (Commercial)
10466:  8.58%: .net (Networks)
 6196:  4.84%: .fr (France)
 6540:  4.34%: .be (Belgium)
 1633:  1.26%: .jp (Japan)
 1675:  1.25%: .ca (Canada)
 1339:  1.02%: .de (Germany)
 1893:  0.87%: .pt (Portugal)
  495:  0.47%: .ma (Morocco)
  464:  0.40%: .dk (Denmark)
  391:  0.38%: .it (Italy)
  293:  0.33%: .uk (United Kingdom)
  354:  0.28%: [domain not given]
  475:  0.27%: .ch (Switzerland)
  282:  0.17%: .br (Brazil)
  135:  0.17%: .at (Austria)
  133:  0.15%: .hu (Hungary)
   78:  0.08%: .mil (USA Military)
   29:  0.08%: .edu (USA Higher Education)
   62:  0.06%: .es (Spain)
   63:  0.06%: .au (Australia)
   34:  0.04%: .pl (Poland)
   43:  0.03%: .arpa (Arpanet)
   15:  0.03%: .tw (Taiwan)
    9:  0.02%: .co (Colombia)
    9:  0.02%: .hk (Hong Kong)
   35:  0.02%: .se (Sweden)
   13:  0.02%: .ar (Argentina)
   27:  0.02%: .cy (Cyprus)
   29:  0.02%: .mx (Mexico)
   10:  0.02%: .il (Israel)
   26:  0.02%: .cl (Chile)
   19:  0.01%: .do (Dominican Republic)
   11:  0.01%: .ee (Estonia)
    4:  0.01%: .us (United States)
   25:  0.01%: .fi (Finland)
    7:  0.01%: .sg (Singapore)
   10:  0.01%: .my (Malaysia)
    7:  0.01%: .si (Slovenia)
   15:  0.01%: .ru (Russia)
    8:  0.01%: .id (Indonesia)
    7:  0.01%: .lt (Lithuania)
    2:  0.01%: .kr (South Korea)
    2:  0.01%: .cz (Czech Republic)
    2:  0.01%: [unknown domain]
    2:  0.01%: .tr (Turkey)
    8:  0.01%: .ua (Ukraine)
    4:       : .za (South Africa)
    2:       : .info (Informational)
    4:       : .biz (Businesses)
    1:       : .cn (China)
    1:       : .no (Norway)
    1:       : .ro (Romania)
(Go To: Top: General Summary: Monthly Report: Daily Summary: Hourly Summary: Domain Report: Organisation Report: Operating System Report: Status Code Report: File Size Report: File Type Report: Directory Report)
This report lists the organisations of the computers which requested files.
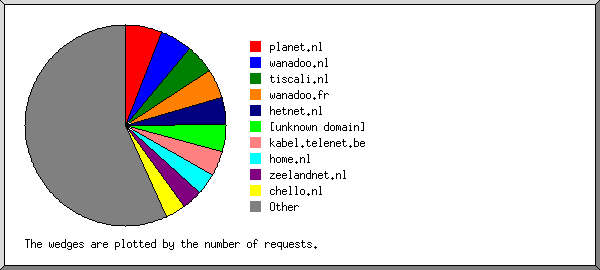
Listing the top 20 organisations by the number of requests, sorted by the number of requests.
 reqs: %bytes: organisation
-----: ------: ------------
 5884:  2.82%: planet.nl
 4987:  3.36%: wanadoo.nl
 4711:  1.90%: tiscali.nl
 4511:  3.35%: wanadoo.fr
 4392:  2.91%: hetnet.nl
 4292:  3.16%: [unknown domain]
 3806:  1.97%: kabel.telenet.be
 3425:  2.67%: home.nl
 3224:  3.25%: zeelandnet.nl
 3145:  2.41%: chello.nl
 2997:  1.31%: surf.net
 2731:  3.27%: xs4all.nl
 2008:  1.09%: direct-adsl.nl
 1738:  1.73%: adsl.skynet.be
 1537:  2.94%: 66.180
 1397:  2.56%: msn.com
 1362:  0.78%: bbtec.net
 1237:  0.66%: quicknet.nl
 1170:  0.78%: sympatico.ca
 1170:  0.90%: aol.com
38357: 56.21%: [not listed: 916 organisations]
(Go To: Top: General Summary: Monthly Report: Daily Summary: Hourly Summary: Domain Report: Organisation Report: Operating System Report: Status Code Report: File Size Report: File Type Report: Directory Report)
This report lists the operating systems used by visitors.
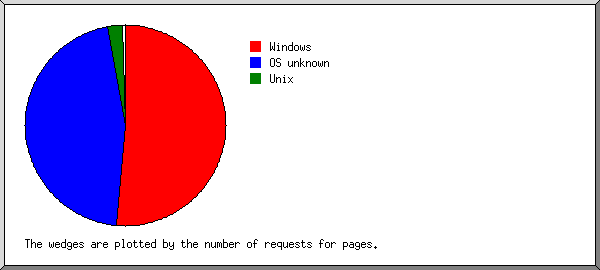
Listing operating systems, sorted by the number of requests for pages.
no.:  reqs: pages: OS
---: -----: -----: --
  1: 82159:  2629: Windows
   : 17028:  1283:   Windows 98
   : 50629:   985:   Windows XP
   :  9196:   252:   Windows 2000
   :  4567:    62:   Windows ME
   :   493:    21:   Windows NT
   :   147:    13:   Unknown Windows
   :    95:    12:   Windows 95
   :     4:     1:   Windows CE
  2: 11573:  2343: OS unknown
  3:  2616:   125: Unix
   :  2553:   115:   Linux
   :    50:     8:   FreeBSD
   :     5:     1:   SunOS
   :     4:     1:   Other Unix
   :     4:     0:   OpenBSD
  4:   909:    22: Macintosh
(Go To: Top: General Summary: Monthly Report: Daily Summary: Hourly Summary: Domain Report: Organisation Report: Operating System Report: Status Code Report: File Size Report: File Type Report: Directory Report)
This report lists the HTTP status codes of all requests.
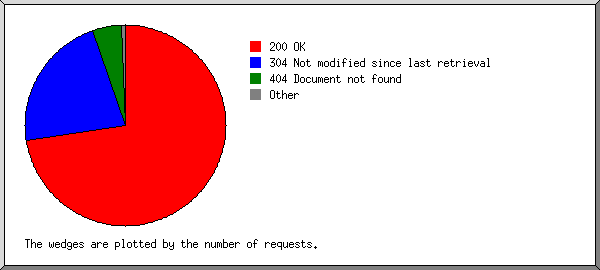
Listing status codes, sorted numerically.
 reqs: status code
-----: -----------
75047: 200 OK
   43: 206 Partial content
  396: 301 Document moved permanently
   90: 302 Document found elsewhere
22991: 304 Not modified since last retrieval
   17: 400 Bad request
   65: 403 Access forbidden
 4892: 404 Document not found
   16: 408 Request timeout
    6: 501 Request type not supported
(Go To: Top: General Summary: Monthly Report: Daily Summary: Hourly Summary: Domain Report: Organisation Report: Operating System Report: Status Code Report: File Size Report: File Type Report: Directory Report)
This report lists the sizes of files.
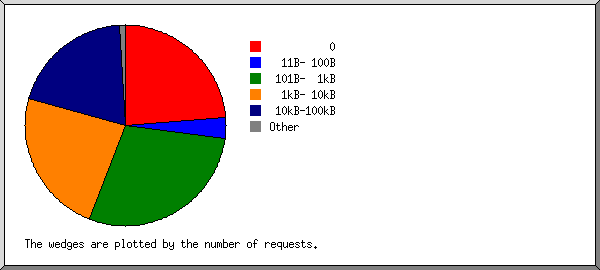
       size:  reqs: %bytes:
-----------: -----: ------:
          0: 23329:       :
   1B-  10B:     3:       :
  11B- 100B:  3381:  0.03%:
 101B-  1kB: 27990:  1.20%:
  1kB- 10kB: 23022: 15.68%:
 10kB-100kB: 19422: 52.56%:
100kB-  1MB:   885: 21.10%:
  1MB- 10MB:    49:  9.43%:
(Go To: Top: General Summary: Monthly Report: Daily Summary: Hourly Summary: Domain Report: Organisation Report: Operating System Report: Status Code Report: File Size Report: File Type Report: Directory Report)
This report lists the extensions of files.
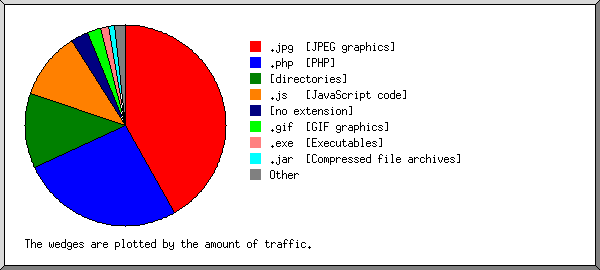
Listing extensions with at least 0.1% of the traffic, sorted by the amount of traffic.
 reqs: %bytes: extension
-----: ------: ---------
 9430: 41.82%: .jpg  [JPEG graphics]
20721: 26.17%: .php  [PHP]
 5143: 12.19%: [directories]
 7847: 10.90%: .js   [JavaScript code]
 1576:  2.85%: [no extension]
49489:  2.15%: .gif  [GIF graphics]
   76:  1.21%: .exe  [Executables]
   14:  1.06%: .jar  [Compressed file archives]
 3222:  0.94%: .css  [Cascading Style Sheets]
    9:  0.49%: .cab  [Cabinet files/ Install Shield Compressed file archives]
  554:  0.22%: [not listed: 20 extensions]
(Go To: Top: General Summary: Monthly Report: Daily Summary: Hourly Summary: Domain Report: Organisation Report: Operating System Report: Status Code Report: File Size Report: File Type Report: Directory Report)
This report lists the directories from which files were requested. (The figures for each directory include all of its subdirectories.)
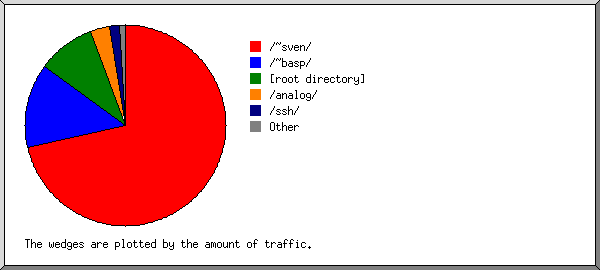
Listing directories with at least 0.01% of the traffic, sorted by the amount of traffic.
 reqs: %bytes: directory
-----: ------: ---------
80690: 71.36%: /~sven/
 9312: 13.64%: /~basp/
 5089:  9.34%: [root directory]
  870:  3.23%: /analog/
   34:  1.55%: /ssh/
  862:  0.36%: /images/
  299:  0.28%: /cgi-bin/
  399:  0.13%: /themes/
   27:  0.07%: [no directory]
   21:  0.02%: http://
  459:  0.01%: /icons/
   19:  0.01%: [not listed: 3 directories]
(Go To: Top: General Summary: Monthly Report: Daily Summary: Hourly Summary: Domain Report: Organisation Report: Operating System Report: Status Code Report: File Size Report: File Type Report: Directory Report)

